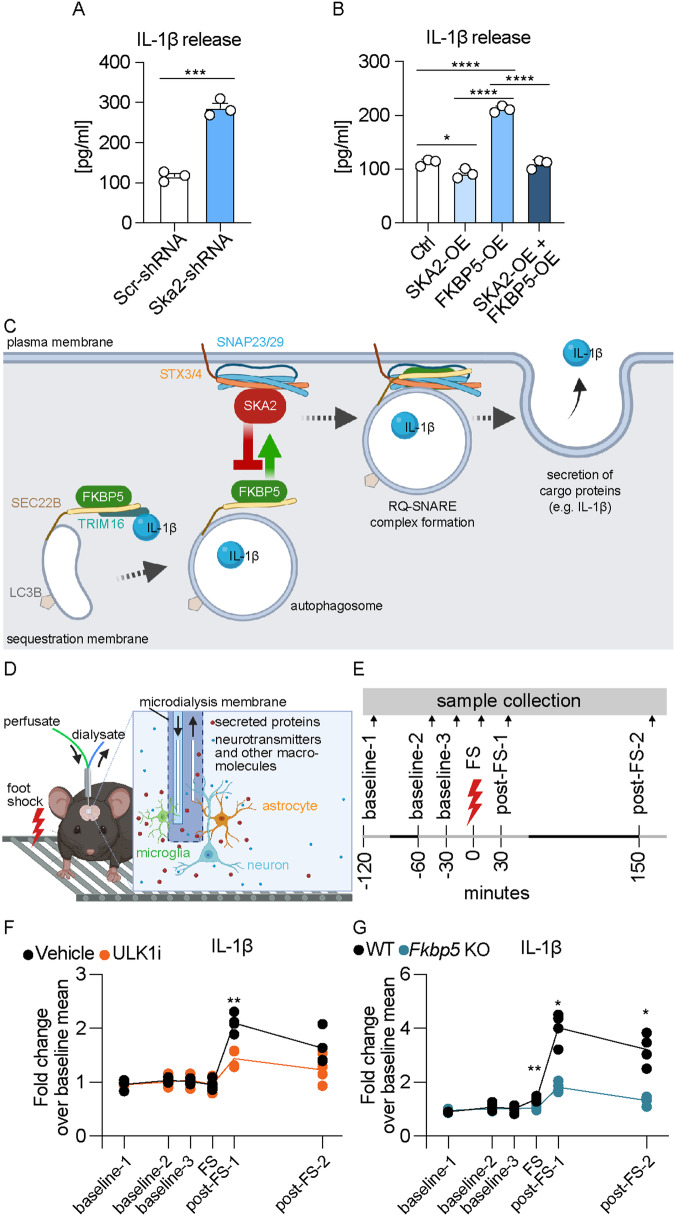
Fig. 2. Activation of secretory autophagy (SA) increases cargo protein release in vitro and in vivo.
A, B IL-1β release measured via ELISA from supernatants of SIM-A9 cells 24 h after manipulation of SKA2 and/or FKBP5 expression, and following overnight LPS (100 ng/mL) and treatment with LLOMe (0.25 mM) for 3 h (unpaired two tailed t-test: (A) t4 = 11.99, p = 0.0003; one-way ANOVA: B F3, 8 = 158.6, p < 0.0001; Tukey’s post hoc test: ctrl vs. SKA2-OE, p = 0.0384, ctrl vs. FKBP5-OE, p < 0.0001, SKA2-OE vs. FKBP5-OE, p < 0.0001, FKBP5-OE vs. SKA2 + FKBP5 OE, p < 0.0001; n = mean derived from three independent in vitro experiments). C Schematic overview of the SA pathway with SKA2 and FKBP5. The cargo receptor TRIM16, together with SEC22B, transfers molecular cargo (e.g., IL-1β) to the autophagy-related LC3B-positive membrane carriers. SEC22B, now acting as an R-SNARE on the delimiting membrane facing the cytosol, carries out fusion at the plasma membrane in conjunction with the Qbc-SNAREs, SNAP23 and SNAP29 (SNAP23/29), and one of the plasma membrane Qa-SNAREs, STX3 or STX4 (STX3/4), thus delivering IL-1β to the extracellular milieu, where it exerts its biological functions. FKBP5 acts as a positive regulator of SA by enhancing TRIM16-SEC22B complex formation as well as autophagosome-plasma membrane fusion via the SNARE-protein complex assembly. In contrast, SKA2 inhibits the SNARE-protein complex formation during vesicle-plasma membrane fusion, thereby acting as gatekeeper of SA. D, E Schematic overview of in vivo microdialysis and the experimental design and timeline; each sample was collected over 30 min indicated by the light gray lines. Quantifications of IL-1β, determined by capillary-based immunoblotting from in vivo medioprefrontal cortex microdialysis of C57Bl/6NCrl mice injected intraperitoneally with ULK1 inhibitor (ULK1i, an autophagy inhibitor) or saline (F; repeated measures two-way ANOVA, time × treatment interaction: F5, 30 = 7.064, p = 0.0002; Šidák’s multiple comparisons post hoc test, post-FS-1: p = 0.0084; n = 4 mice per group) as well as of wild type (WT) and global Fkbp5 knockout mice (G; repeated measures two-way ANOVA, time × genotype interaction: F5, 30 = 34.15, p < 0.0001; Šidák’s multiple comparisons post hoc test: FS: p = 0.009, post-FS-1: p = 0.0163, post-FS-2: p = 0.0294; n = 4 mice per group). FS foot shock. * = p < 0.05; ** = p < 0.01; *** = p < 0.001; **** = p < 0.0001. Data are presented as mean + SEM. Source data are provided as a Source Data file.

