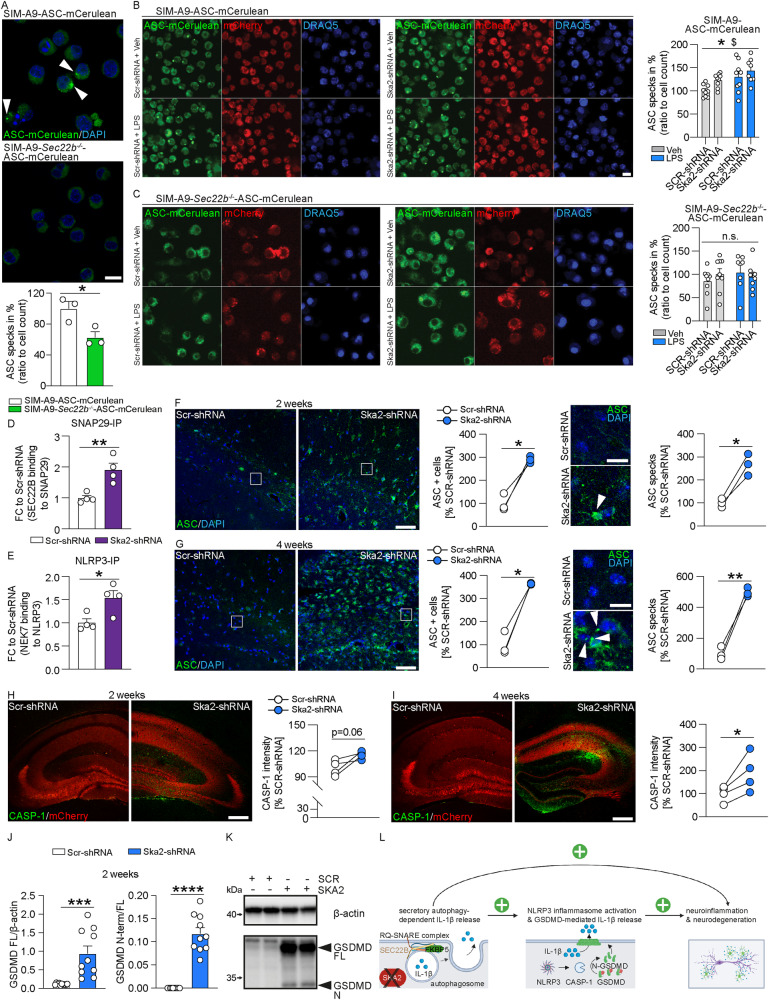
Fig. 4. Hyperactivity of SA induces inflammasome formation.
A SIM-A9 Sec22b−/− cells expressing ASC (apoptosis-associated speck-like protein containing a CARD) -mCerulean (via epifluorescence) show a significantly decreased number of intracellular (white arrows) ASC specks compared to wild type (WT) SIM-A9 cells (unpaired two tailed t-test: t4 = 3.206, p = 0.0327; n = mean derived from three independent in vitro experiments). B In WT SIM-A9 cells knockdown of Ska2 or LPS treatment leads to a significantly increased number of intracellular ASC specks compared to Scr-shRNA or LPS-treated cells (2-way ANOVA: main LPS treatment effect ($), F1,31 = 10.60, p = 0.0027, main Ska2 knockdown effect (*), F1,31 = 5.482, p = 0.0258; n = 9 WT Veh SCR-shRNA, n = 9 WT Veh SKA2-shRNA, n = 9 WT LPS SCR-shRNA, n = 8 WT LPS SKA2-shRNA). C In contrast, knockdown of Ska2 or LPS treatment does not have any effects on the number of ASC specks in SIM-A9 Sec22b−/− cells (2-way ANOVA: n. s. treatment effect F1,29 = 0.312, p = 0.5804, main Ska2 knockdown effect, F1,29 = 0.055, p = 0.8157; n = 9 for SEC22B KO Veh SCR-shRNA and SKA2-shRNA, n = 7 SEC22B KO LPS SCR-shRNA, n = 8 SEC22B KO LPS SKA2-shRNA). D, E Knockdown of Ska2 leads to significantly increased SEC22B binding to SNAP29 (unpaired two tailed t-test: t4 = 4.113, p = 0.0063; n = 4 independent biological replicates) as well as NEK7 binding to NLRP3 in protein lysates of organotypic hippocampal slice cultures (unpaired two tailed t-test: t4 = 2.998, p = 0.0241; n = 4 independent biological replicates). F IHC images of ASC (green) and DAPI (blue) 2 weeks after viral injection (Scr-shRNA-AAV and Ska2-shRNA-1-AAV) into the hippocampus. Quantification of ASC+ cells (left) and ASC specks (right) 2 weeks after viral injection (paired t-test: ASC+ cells, t2 = 6.414, p = 0.0235, ASC specks, t2 = 6.937, p = 0.0202; n = 3 mice). G IHC images of ASC (green) and DAPI (blue) 4 weeks after viral injection (Scr-shRNA-AAV and Ska2-shRNA-1-AAV) into the hippocampus. Quantification of ASC+ cells (left) and ASC specks (right) 4 weeks after viral injection (paired t-test: ASC+ cells, t2 = 8.511, p = 0.0135; ASC specks, t2 = 10.99, p = 0.0082; n = 3 mice). H IHC images of CASPASE-1 (CASP-1) (green) and mCherry (red, viral marker) 2 weeks after viral injection (Scr-shRNA-AAV and Ska2-shRNA-1-AAV) into the hippocampus (left). (right) Quantification of CASP-1 expression 2 weeks after viral injection (paired t-test: t3 = 2.842, p = 0.0655, n = 4 mice). I IHC images of CASP-1 (green) and mCherry (red, viral marker) 4 weeks after viral injection (Scr-shRNA-AAV and Ska2-shRNA-1-AAV) into the hippocampus (left). (right) Quantification of CASP-1 expression 4 weeks after viral injection (paired t-test: t3 = 3.367, p = 0.0435, n = 4 mice). J Full length Gasdermin D (GSDMD FL) levels as well as the ratio of the cleaved N-terminal form of GSDMD (GSDMD N-term) to GSDMD FL are increased 2 weeks after Ska2 knockdown (unpaired two tailed t-test; GSDMD FL/ β-actin: t18 = 4.105, p = 0.0007, GSDMD N-term/GSDMD FL: t18 = 9.259, p < 0.0001; n = 10 independent biological replicates per group). K Examples blots of (E). L Schematic overview of the interaction between secretory autophagy (SA) and the GSDMD-mediated IL-1β release. SKA2 depletion results in increased SA-dependent IL-1β release, serving as a molecular vicious feed-forward loop for inflammasome activation. Inflammasome assembly activates CASP-1 enzymatic function. ASC in the inflammasome complex recruits CASP-1. Activation of CASP-1 cleaves GSDMD to release the N-terminal domain, which forms pores in the plasma membrane for uncontrolled IL-1β release. * = p < 0.05; ** = p < 0.01; *** = p < 0.001, **** = p < 0.0001. Data are presented as mean + SEM. Scale bar represents 5 µm in A, 50 µm in (F, G) (left), 10 µm in (B, F, G) (right), and 250 µm in (H, I). Source data are provided as a Source Data file.

