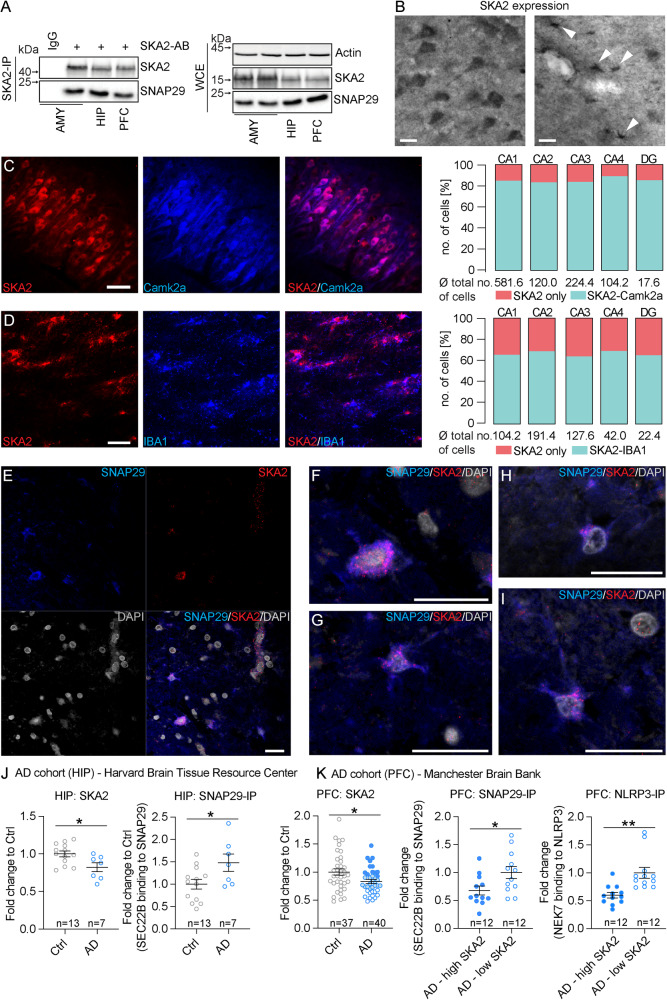
Fig. 7. Secretory autophagy is increased in human postmortem Alzheimer’s disease samples.
A SNAP29 co-immunoprecipitation (SKA2 IP) and whole cell extract (WCE) control in amygdala (AMY), hippocampus (HIP), and prefrontal cortex (PFC) human postmortem samples (n = 3). B SKA2 immunostaining in neurons in CA1 stratum pyramidale (left) and microglia in CA1 stratum oriens (right) of the HIP from control subjects (n = 5). C Representative co-immunohistochemistry (IHC) image (left) and quantification (right) of SKA2 (red) and neuronal marker Camk2a (blue) in the HIP (n = 5). D Representative co-IHC image in stratum oriens CA1 of the HIP (left) and quantification (right) of SKA2 (red) and microglia marker IBA1 (blue) (n = 5). E–I Co-IHC images of the HIP from control subjects (n = 5 control subjects) depict cells labeled with antibodies against SNAP29, SKA2 or DAPI, and the overlap of the three markers. The colocalization of SKA2 with SNAP29 was observed on the cell-surface and cytoplasm of neurons (F) as well as in microglia (G–I). High-resolution images capturing single slices through the z-axis indicate that the majority of SKA2 and SNAP29 labeling is not localized within the DAPI-positive nuclei (H&I). J AD cohort from the Harvard Brain Tissue Resource Center (Ctrl n = 13 (8M/5F), AD n = 7 (4M/3F)): SKA2 protein expression (left) is significantly decreased in the hippocampus of AD subjects (ANCOVA: F1,19 = 6.9123, p = 0.0170) while SEC22B binding to SNAP29 (right) is significantly increased in hippocampus tissue of AD subjects (ANCOVA: F1,19 = 5.6769, p = 0.0284). K AD cohort from the Manchester Brainbank (Ctrl n = 37 (10M/27F), AD n = 40 (14M/26F)): SKA2 protein expression (left) is significantly decreased in the prefrontal cortex (PFC) of AD subjects (ANCOVA: F1,76 = 6.4994, p = 0.0128). SEC22B binding to SNAP29 (middle) as well as NEK7 binding to NLRP3 (right) is significantly increased in PFC tissue of the top 12 low (5M/7F) compared to the top 12 high (5M/7F) SKA2 expressing AD subjects (ANCOVA: SEC22B to SNAP29: F1,23 = 2.411, p = 0.0247, NEK7 to NLRP3: F1,23 = 3.696, p = 0.0013). * = p < 0.05; data are presented as mean ± SEM. Scale bars represent 50 µm for (B, D), 100 µm for (C), and 20 µm for (E–I). Source data are provided as a Source Data file.

