Figure 3.
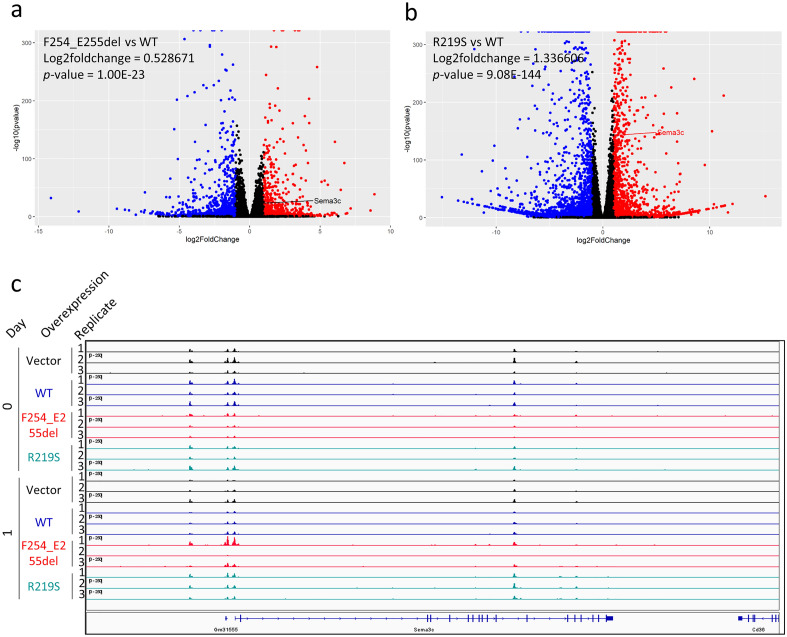
Global expression in murine organoids overexpressing Foxa1 constructs. Volcano plots comparing p.F254_E255del to WT (a) and p.R219S to WT (b) in the RNA-Seq data by Adams et al. (subseries GSE128666). X-axis is log2-fold change and y-axis is − log10 p-value. Day 1 triplicate data from Adams et al. was used. Expression is relative to wild-type Foxa1. Red is ≥ twofold upregulation and p < 0.05; blue is ≥ twofold downregulation and p < 0.05. The expression of Sema3c is indicated. Within the plot, Sema3c is highlighted. (c) ATAC-Seq bigWig files (subseries GSE128421) were visualized in Integrative Genomics Viewer. Day 0 and 1 in empty vector (black), wildtype (blue), Foxa1 p.F254_E255del (red), and Foxa1 p.R219S (cyan) are displayed. The Sema3c gene is shown below. Y-axes are fixed at 250.

