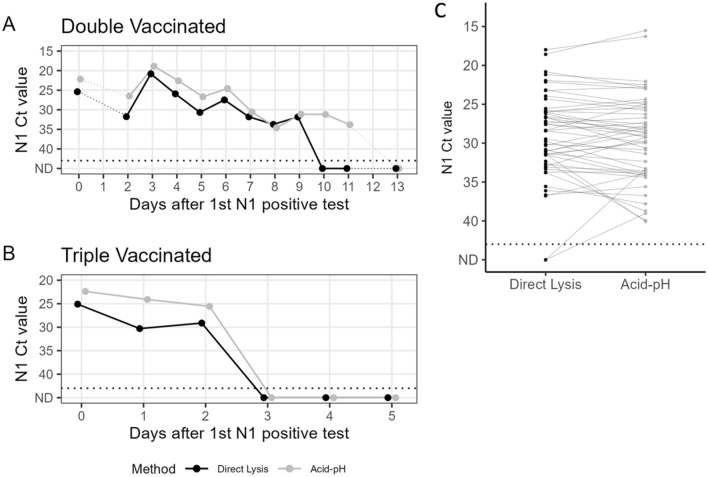
Figure 8.
Case study comparison and SARS-CoV-2 positive saliva comparisons of acid-pH and Direct Lysis methods. Two cases where people tested positive and were able to collect their own saliva over multiple days, and the saliva was tested with both Acid-pH and Direct Lysis Methods. Each point represents the average Ct of N1 based on two PCR replicates. The individual in (A) was double vaccinated, with samples ranging from Day 0–13 days after N1 was initially detected in their saliva. No samples from Day 1 or Day 12 were received. The individual in (B) was triple vaccinated, where we had samples ranging from Day 0–5 days after N1 was initially detected in their saliva. (C) 51 SARS-CoV-2 positive saliva samples were processed with both methods to compare the Acid-pH and Direct Lysis methods. Each point represents the average Ct of N1 bsed on two PCR replicates (ns, t test).

