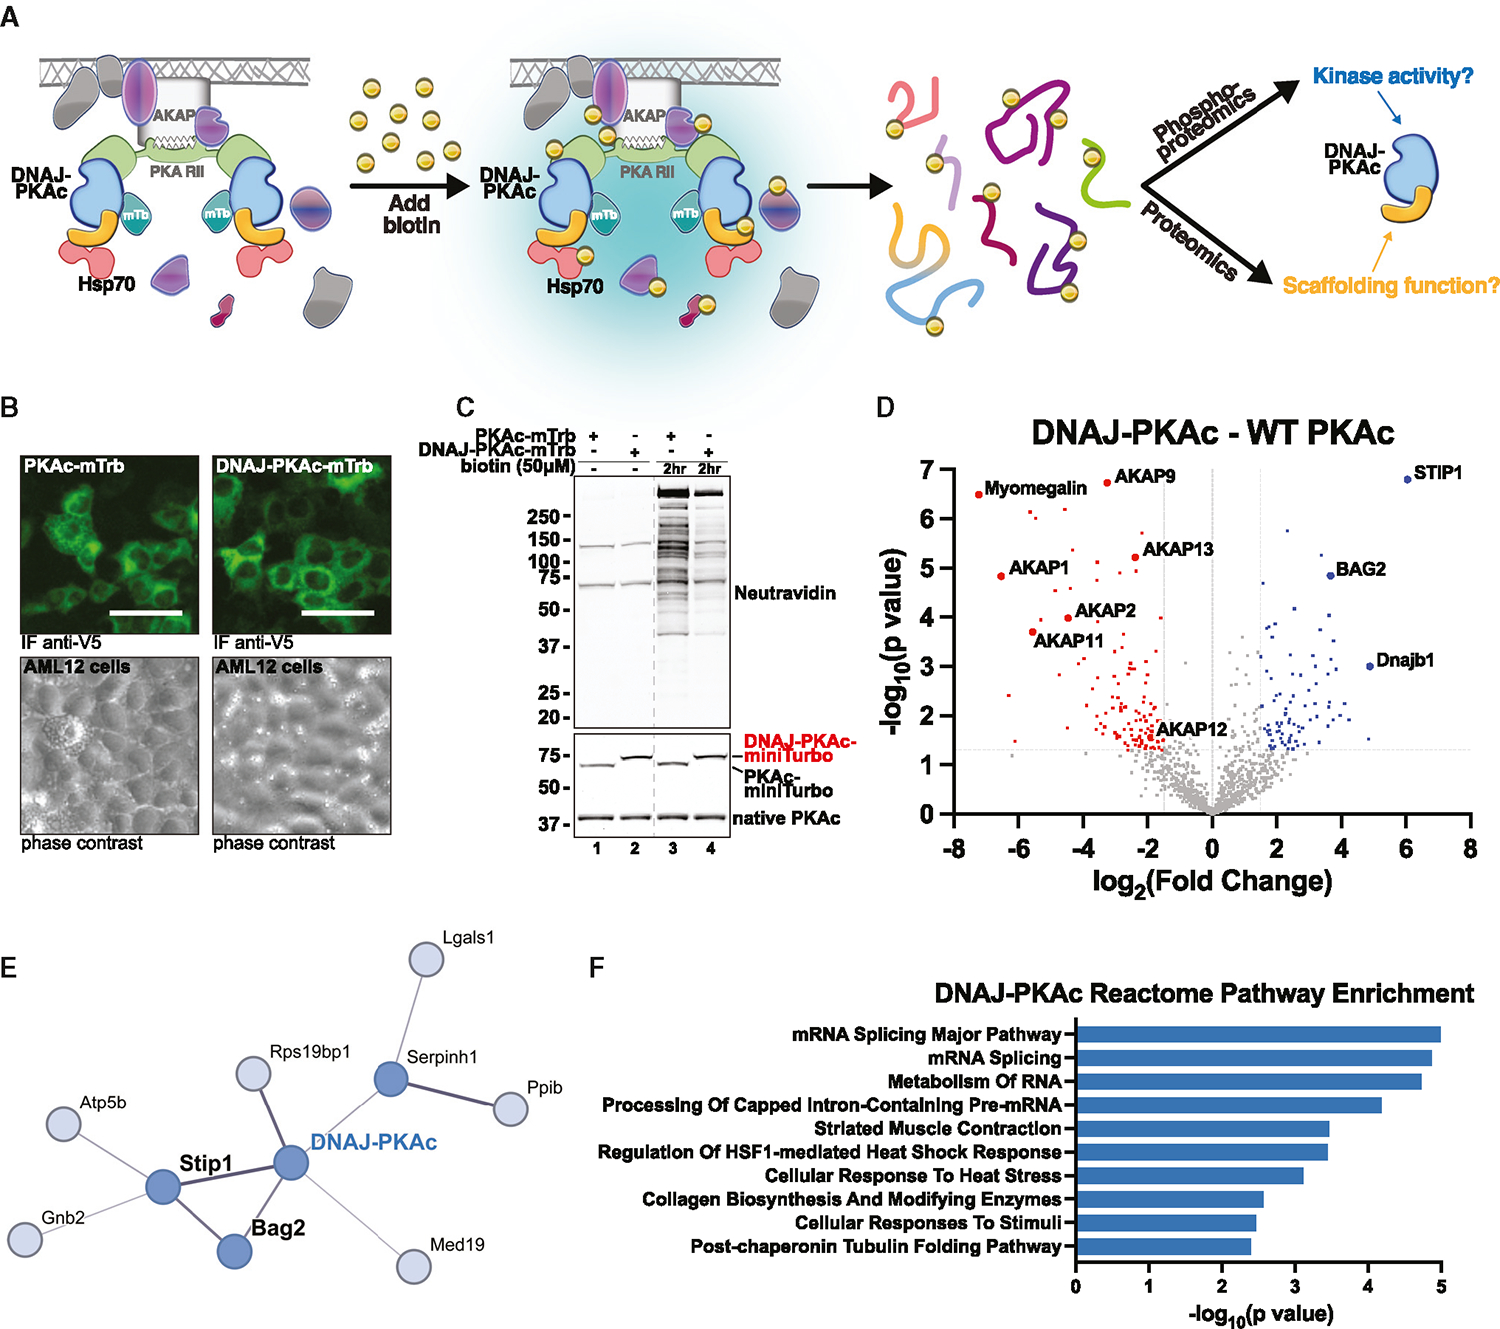
Figure 1. Enzyme-catalyzed proximity labeling identifies molecular associations with DNAJ-PKAc.

(A) Schematic of miniTurbo (mTrb)-driven proximity labeling workflow and study design. Addition of biotin allows labeling of proteins within a 5- to 10-nm radius of bait proteins. Following isolation, biotinylated or phosphorylated peptides were subjected to MS analysis.
(B) Immunofluorescence imaging of AML12 hepatocytes demonstrating inducible expression of PKAc-mTrb (green, top left) or DNAJ-PKAc-mTrb (green, top right) with corresponding phase contrast (bottom). Scale bars, 50 μm
(C) Immunoblot of cell lysates from stable AML12 lines treated with either DMSO or biotin (50 mM). Neutravidin-HRP (top) shows labeling of biotinylated proteins. PKAc (bottom) shows expression of mTrb-tagged PKAc variants (top band) over native PKAc (bottom band). The dashed line removes lanes from a separate experiment.
(D) Volcano plot of MS results, showing proteins with increased (blue) and decreased (red) association with DNAJ-PKAc compared with WT PKAc. Proteins with p > 0.05 and log2 fold change less than 1.5 are shown in gray. Six biological replicates.
(E) STRING network depiction of selected proteins with greater enrichment in DNAJ-PKAc versus WT PKAc.
(F) Bar chart of the top 10 enriched terms from the Reactome 2022 gene set library for proteins more associated with DNAJ-PKAc. Results are displayed based on −log10(p value).
