
Figure 4. Substrates of DNAJ-PKAc are regulators of ribosome biogenesis and translation.
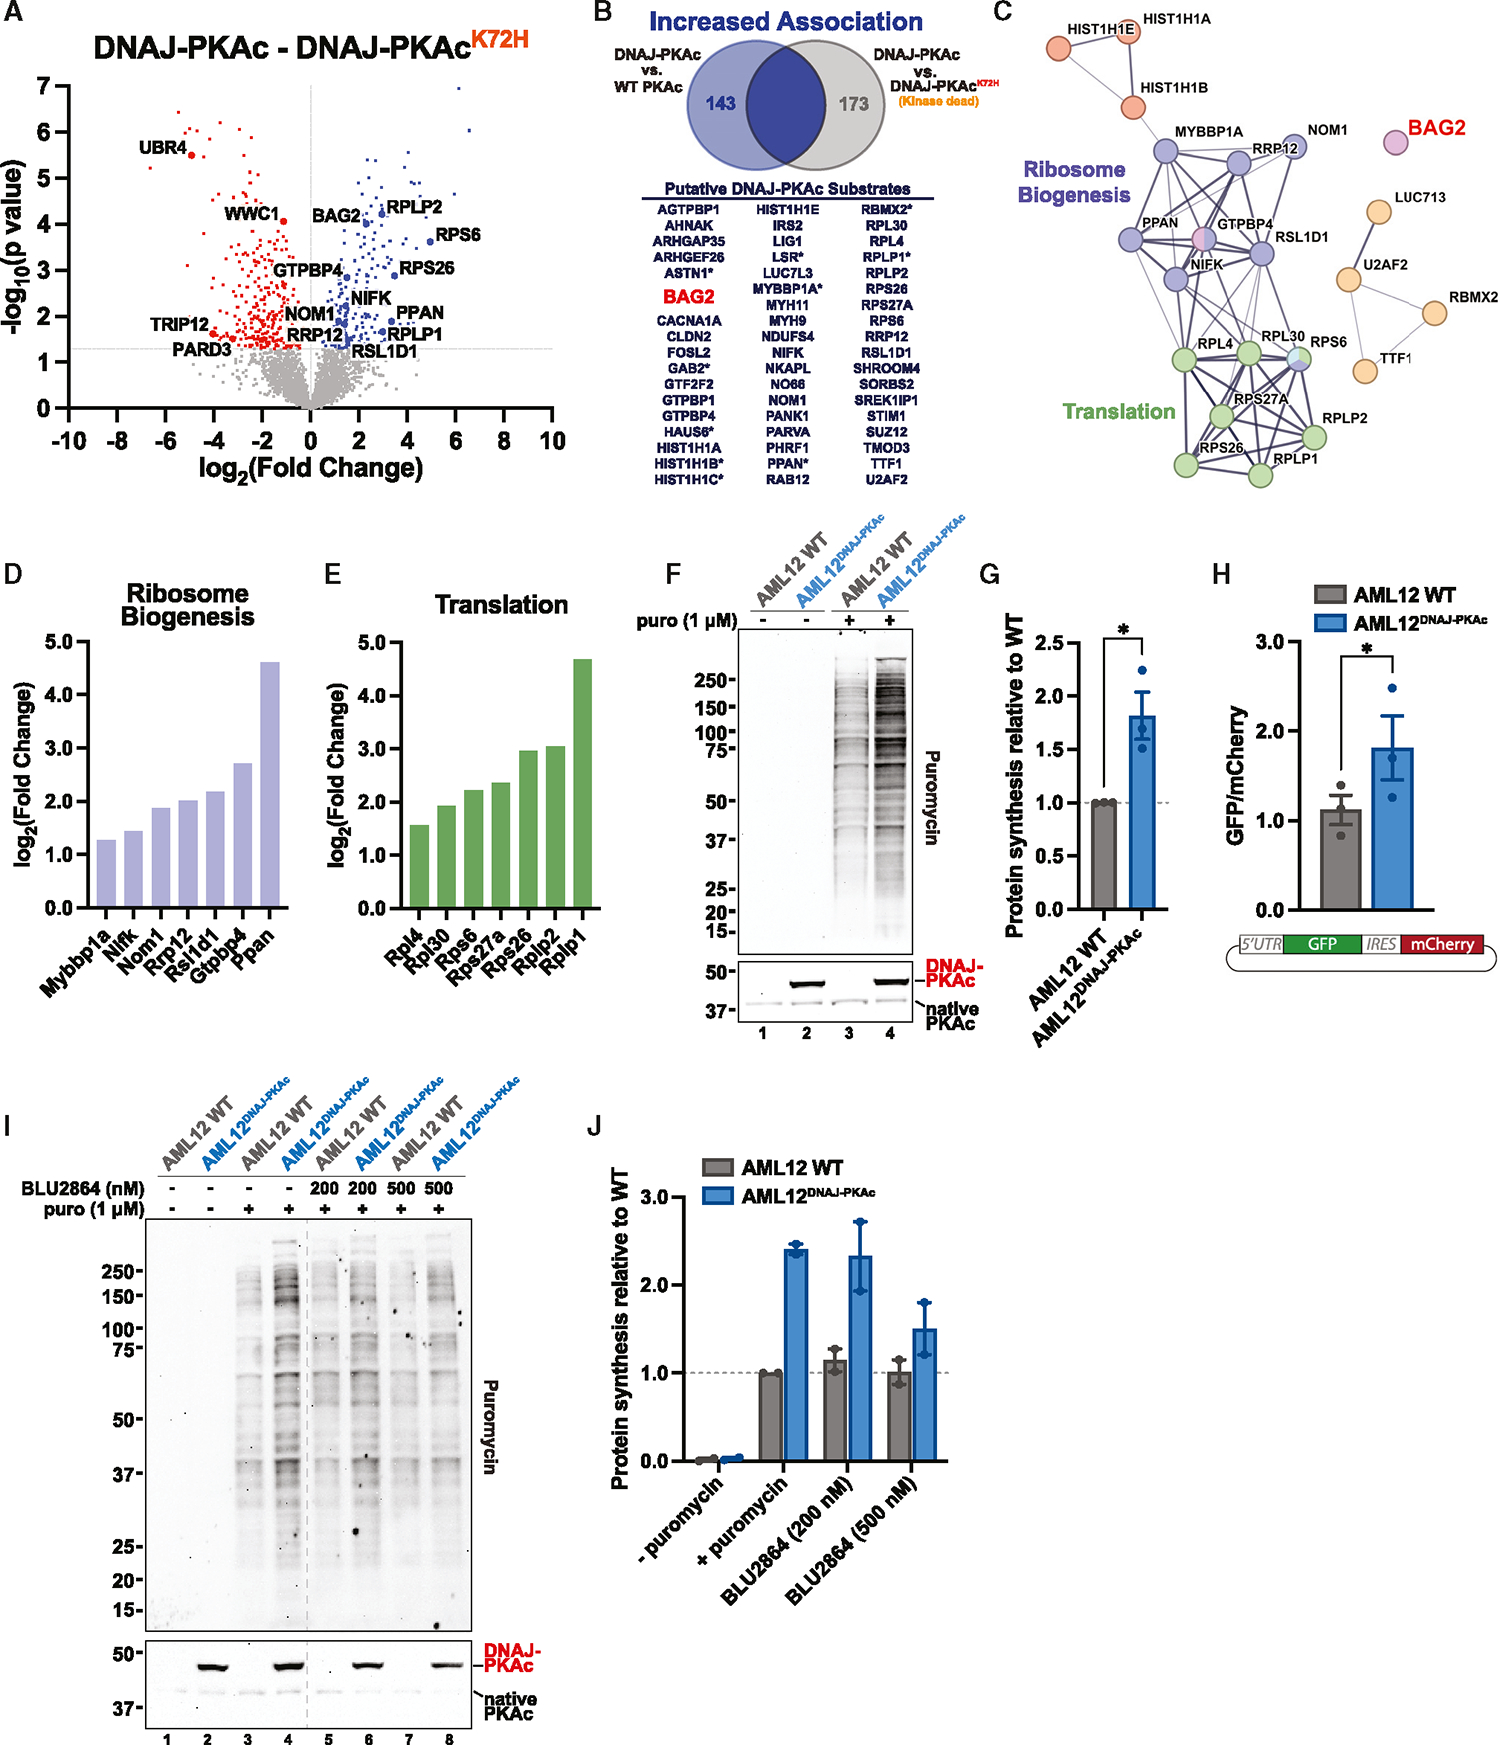
(A) Volcano plot of MS results showing phosphopeptides with increased (blue) and decreased (red) association with DNAJ-PKAc compared with DNAJ-PKAcK72H. Proteins with p >0.05 are shown in gray. Four biological replicates.
(B) Venn diagram with resulting list of putative DNAJ-PKAc substrates identified by overlapping phosphosites that have increased association with DNAJ-PKAc versus WT PKAc and DNAJ-PKAcK72H. An asterisk indicates two or more phosphosites identified on a corresponding protein.
(C) STRING network depicting selected functional clusters of putative DNAJ-PKAc substrates.
(D and E) Bar graphs showing log2(fold change) over WT PKAc for DNAJ-PKAc phosphoproteins associated with ribosome biogenesis (D) and translation (E).
(F) Immunoblot of cell lysates from WT AML12 and AML12DNAJ-PKAc treated with either vehicle or puromycin (1 μM). Puromycin conditions (top) show newly synthesized, puromycin-labeled proteins. PKAc (bottom) shows expression of DNAJ-PKAc (top band) over native PKAc (bottom band). See also Figure S3.
(G) Quantification of (F), measuring protein synthesis in AML12DNAJ-PKAc cells versus WT AML12 cells. Data represent 3 biological replicates. Mean ± SEM. *p ≤ 0.05.
(H) Measurement of mRNA translation in WT AML12 cells (gray) and AML12DNAJ-PKAc cells (blue) stably transduced with a bicistronic reporter. Spontaneously cycling cells were analyzed by fluorescence-activated cell sorting (FACS), and a normalized ratio of GFP/mCherry signal was determined. Data represent 3 biological replicates. Student’s t test. Mean ± SEM. *p ≤ 0.05.
(I) Immunoblot of cell lysates from WT AML12 and AML12DNAJ-PKAc cells treated with either vehicle, puromycin (1 μM), or puromycin (1 μM) plus BLU2864 (200 nM or 500 nM). Puromycin conditions (top) show newly synthesized, puromycin-labeled proteins. PKAc (bottom) shows expression of DNAJ-PKAc (top band) over native PKAc (bottom band). The dashed line removes lanes from a separate experiment.
(J) Quantification of (I), measuring protein synthesis in AML12DNAJ-PKAc cells versus WT AML12 cells. Data represent 2 biological replicates. Mean ± SEM.