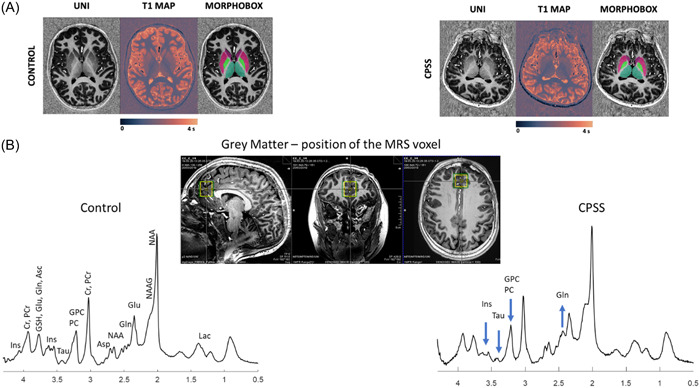
Figure 2.

(A) Representative axial slices MP2RAGE uniform contrast (left), T1maps (middle) and corresponding basal ganglia nuclei segmentation masks (right) of a female CTR (left) and a female CPSS (right). (B) Representative 1H MRS spectra with corresponding voxel position and size on anatomical images (green voxel for shimming, yellow voxel for 1H MRS) acquired at 7T in a voxel located in GM (20 × 20 × 25 mm3) dominated prefrontal cortex. Acquisition parameters: semiadiabatic SPECIAL sequence, TE = 16 ms, TR = 6500 ms, 2 × 50 averages, spectral width of 4000 Hz, 2048 points in FID. No postprocessing was applied except for B0 drift and eddy current corrections. The main metabolites are labeled on the spectrum acquired in the GM CTR while for the other spectrum only the main metabolites changing are labeled (Gln +3.4 fold increase; Ins −17% decrease, Tau −54% decrease, GPC+PCho −26% decrease). GM, gray matter dominant.
