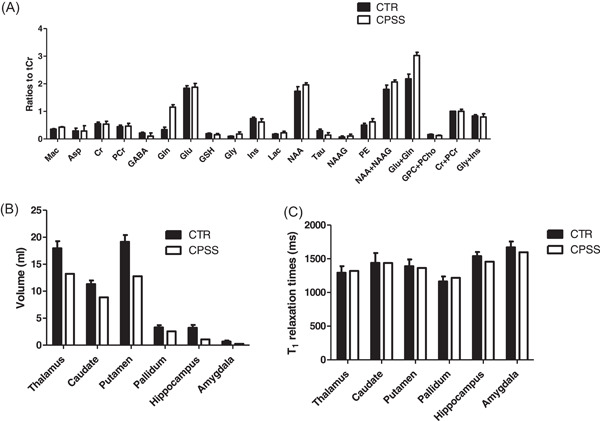
Figure 3.

Brain metabolite changes in GM dominant voxel positioned in prefrontal cortex between CTR (black bars, mean ± SD) and CPSS (white bars, mean ± CRLB) (A), absolute brain volumes in milliliters (mL) (B) and T1 relaxation times in milliseconds (ms) (C) between CTR (black bars) and CPSS (white bars) in six different brain regions. CPSS, congenital porto‐systemic shunts.
