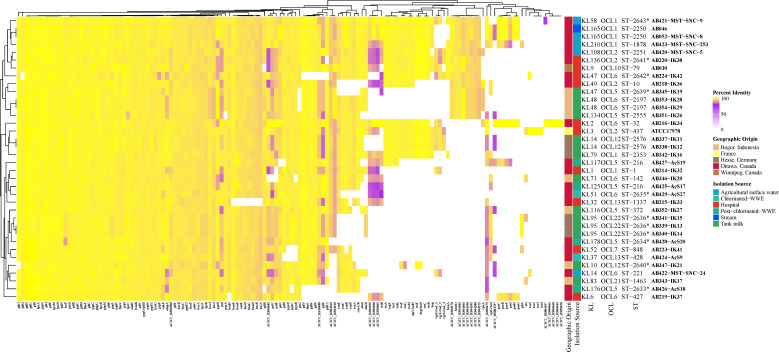
Fig 6.
Virulome determination of all isolates. Percent identity of each gene is used to compare the diversity. The minimum cutoff for nucleotide identity is 80% and is shown in purple. Hierarchical clustering demonstrates similarity based on the virulence gene profile. Capsule locus, outer core locus, and sequence type are listed for each isolate. Those STs with asterisks indicate novel STs identified in this study. Color in each panel represents the isolation source and geographic origin that corresponds to that of all figures.

