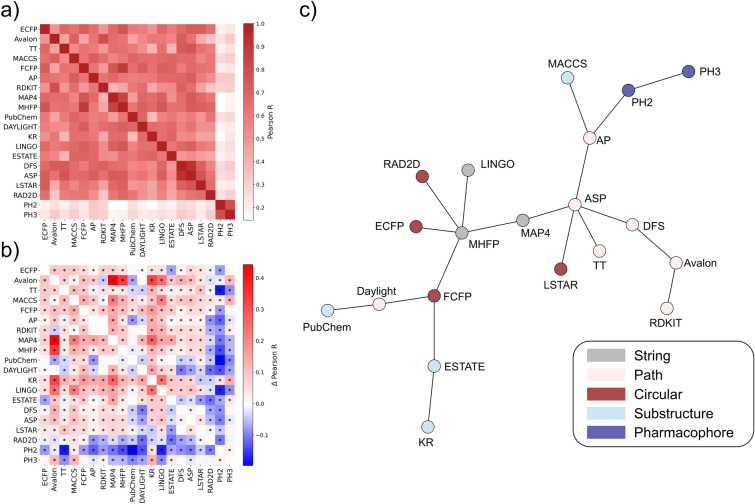
Fig. 2.
Jaccard-Tanimoto similarity correlation analysis for all fingerprints. a Correlation matrix for all fingerprints evaluated in this study on the COCONUT dataset. b Difference between the correlation matrix obtained for the COCONUT dataset and for the Drug Repurposing Hub. Positive values indicate higher fingerprint correlation in the NP space, while negative values denote higher correlation in the drug-like space. Asterisks denote statistical significance according to one-sample Mann Whitney tests with Benjamini–Hochberg correction (α = 0.05). c MST constructed from the fingerprint correlation matrix obtained for the NP chemical space. Each encoding is colored on the basis of its category

