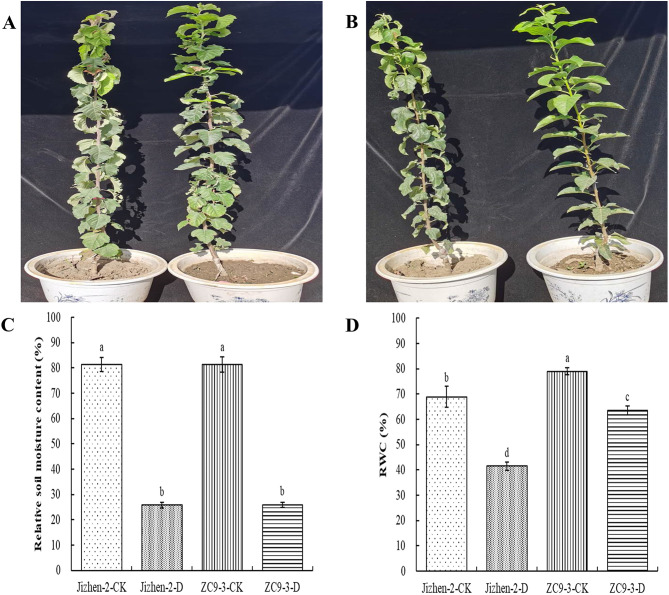
Fig. 1.
Effect of drought stress on the phenotypes and physiological indicators of ‘Jizhen-2’ and ‘ZC9-3’. (A), Phenotypes of Jizhen-2-D (left) and Jizhen-2-CK (right). (B), Phenotypes of ZC9-3-D (left) and ZC9-3-CK (right). (C), Relative soil moisture content (%). (D), Leaf relative water content (RWC, %). CK and D indicate normal watering and drought stress, respectively. Within each panel, bars labeled with different lowercase letters denote significant differences (P ≤ 0.05) according to Duncan’s tests. Each point represents the mean value from three biological replicates, and the vertical bars indicate standard deviations (SDs). The same applies to subsequent figures

