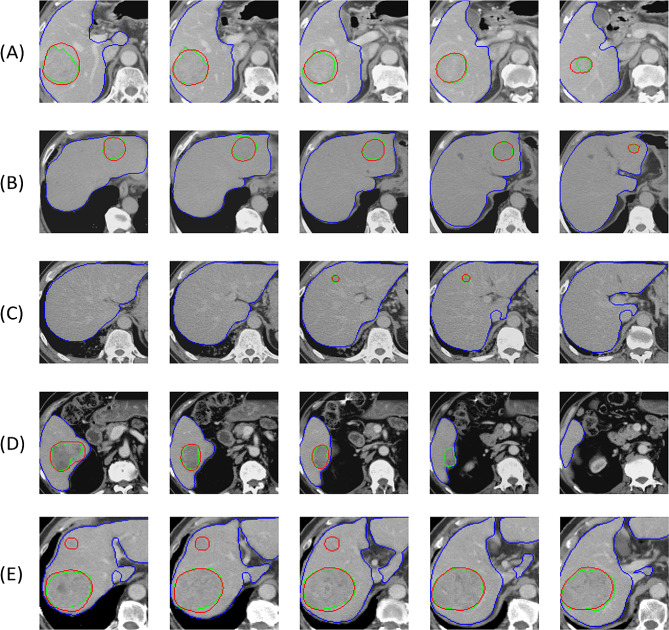
Fig. 3.
Examples of HFS-Net segmentation results from test dataset. A A 8.5 cm HCC representing large HCC (dice per case 88.1%). B A 4.6 cm HCC representing medium sized HCC (dice per case 80%). A A 8.5 cm HCC representing large HCC (dice per case 88.1%). C A 1.7 cm HCC representing BCLC stage 0 HCC (dice per case 83.6%). D A tumor was detected in the first three slices but missed in the marginal slice of the tumor. E A large tumor accurately segmented by HFS-Net, and a small tumor missed by radiologist labelling but detected by HFS-Net. The green line represents the radiologist’s label, the red line represents the output of HFS-Net for tumor margin, and the blue line represents the output of HFS-Net for liver margin

