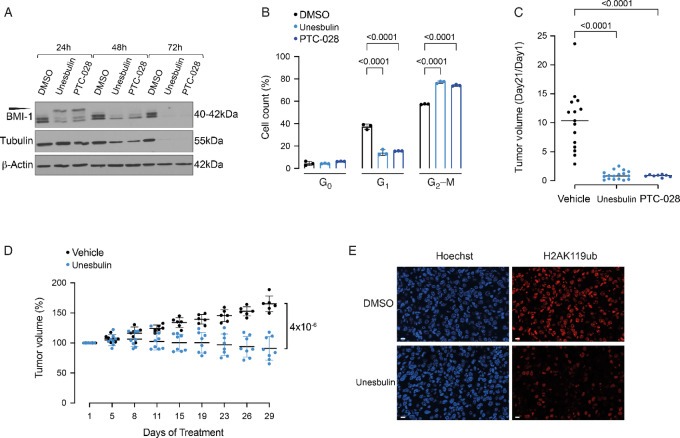
FIGURE 1.
BMI-1 inhibition affects cell cycle progression and tumor growth. A, Western blot analyses of the human H1975 cell line treated for 24, 48, and 72 hours with DMSO Vehicle as control, and Unesbulin or PTC-028. Protein lysates were immunoblotted with an anti-BMI-1 or an anti-Tubulin antibody. Loading was assessed with an anti-β-actin antibody. Expected size is shown in kDa. The slower migrating hyperphosphorylated BMI-1 band is indicated by the arrowhead. B, Cell cycle analysis of the H1975 cell lines after treatment for 24 hours with DMSO (black), Unesbulin (light blue), or PTC-028 (dark blue). The bar charts represent the distribution of cells in G0, G1, and G2–M phases. P values are indicated. Error bars represent SD. Percentages of cells in each cell cycle phase are indicated. C, H1975 xenografts tumor volumes at treatment termination (Vehicle n = 15, black; Unesbulin n = 17, light blue; PTC208 n = 8, dark blue) normalized to the tumor volume measured at the beginning of treatment. The difference in tumor size at day 21 was statistically significant (P values are indicated). D, The graph shows percentage of change in transgenic mice tumor volume measured by MRI at the indicated timepoints, between Unesbulin (n = 8, light blue) and Vehicle-treated (n = 6, black) groups. Error bars represent SD. P value is indicated. E, Confocal microscopy fluorescence nuclear imaging of DNA and H2AK119ub in tumor tissues collected at the end of treatment. Top panels show a representative image of DMSO-treated tumor; bottom panels show a tumor treated with Unesbulin. Left panels show DNA staining by Hoechst 33342 (blue acquisition channel). Right panels show H2AK119ub staining by immunofluorescence (scale bar, 10 µm).

