FIGURE 2.
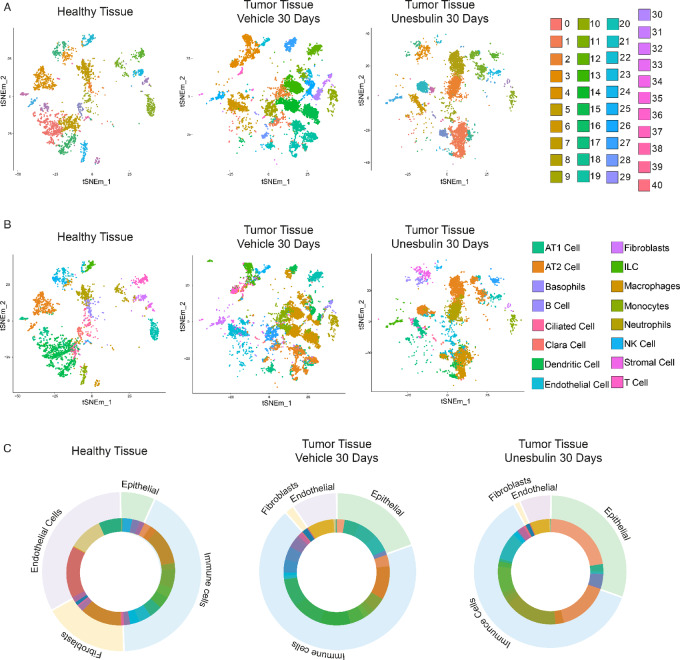
scRNA-seq of healthy and tumor-bearing lungs highlights presence of pulmonary milieu clusters. A, t-SNE plot of the 41 clusters identified in healthy lungs (n = 3, left), and Vehicle- (n = 10, middle), or Unesbulin-treated tumors (n = 3, right), at 30 days. Each point represents one cell. Each color represents a defined transcriptional cluster as shown in the corresponding legends. B, t-SNE plot in which transcriptional clusters have been annotated as epithelial, immune, endothelial, or fibroblast subpopulations. C, Cluster distribution superimposed to clusters annotation within epithelial, immune, endothelial cells, and fibroblasts in healthy lungs (left), and Vehicle- (middle), or Unesbulin-treated tumors (right).

