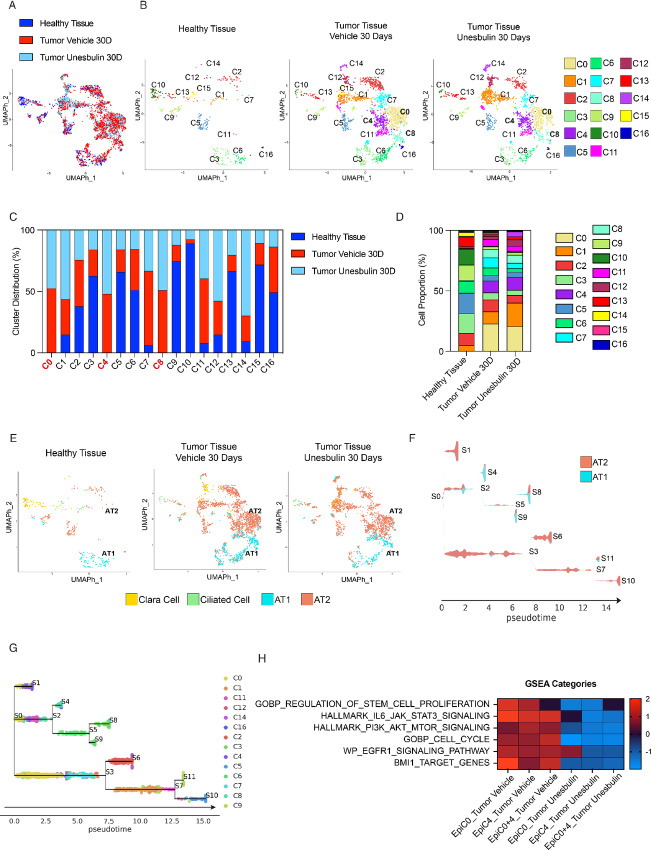
FIGURE 3.
Deconvolution of healthy and diseased epithelial clusters highlights the malignant stem cell nature of C0epi and C4epi. A, UMAP cluster distribution of epithelial cells from healthy lungs (n = 3, dark blue), Vehicle- (n = 10, red), and Unesbulin-treated tumors (n = 3, light blue), up to 30 days. B, Split distribution of the 17 epithelial transcriptional clusters (C0–C16) identified in healthy lungs (left), Vehicle- (middle), and Unesbulin-treated tumors (right). Each color represents a defined transcriptomic cluster. C, Histograms representing C0–C16 percentage distribution per sample (healthy lungs, Vehicle-, and Unesbulin-treated tumors). D, Histograms representing the percentage contributions of C0–C16 clusters per sample (healthy lungs, Vehicle-, and Unesbulin-treated tumors). E, UMAP cluster annotation of epithelial cells from healthy lungs, and Vehicle- and Unesbulin-treated tumors. Each color represents a different epithelial subpopulation. F, STREAM analysis on the AT2/AT1 subpopulations identifies states S0–S11. G, STREAM analysis on the AT2/AT1-annotating clusters depicts trajectories of differentiation. H, Heat map showing GSEA of Vehicle- and Unesbulin-treated C0epi-C4epi identifies signaling pathways enriched in each sample and affected upon treatment.

