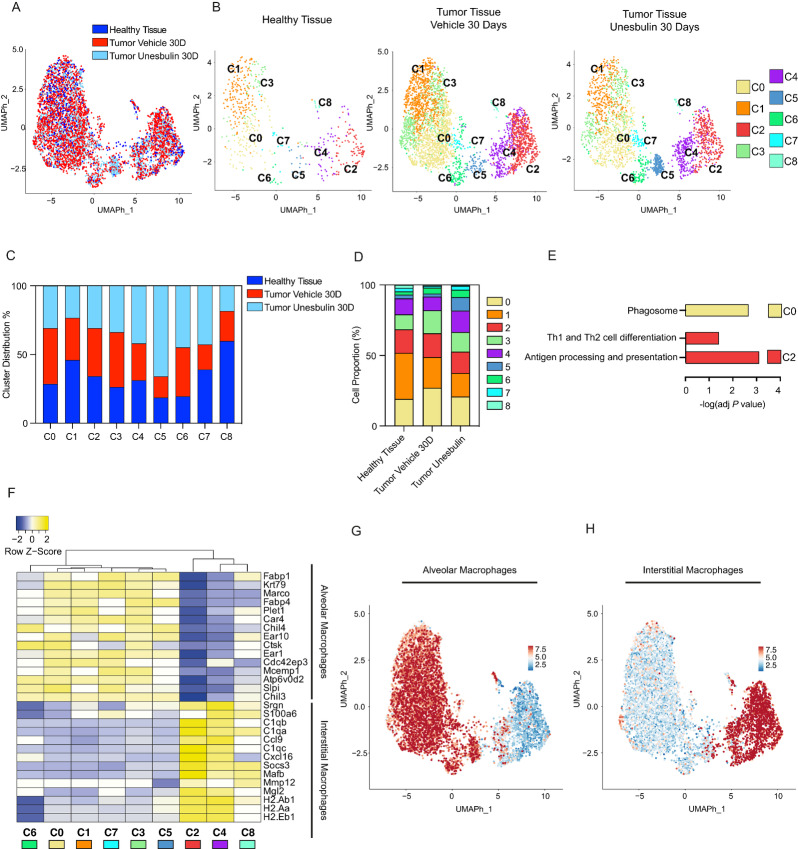
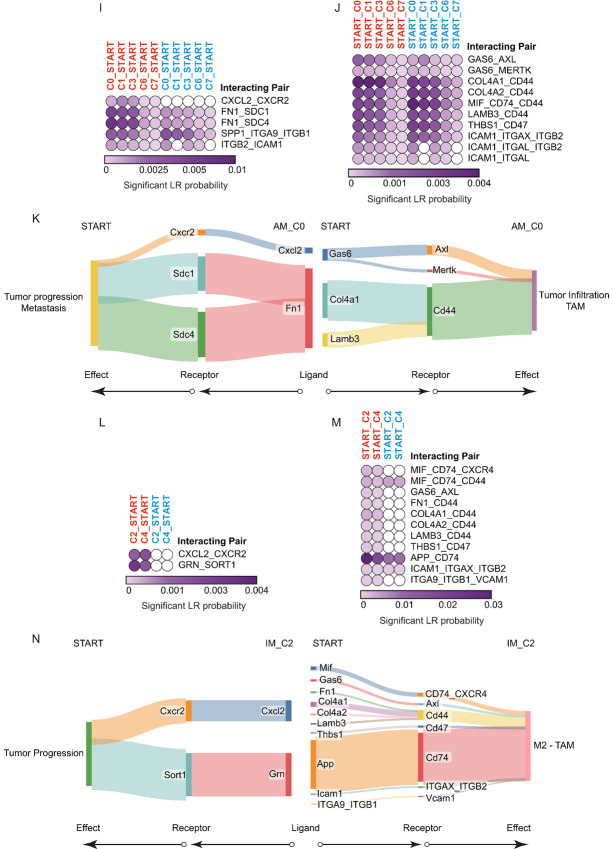
FIGURE 4.
Deconvolution of healthy and diseased macrophage clusters demonstrates presence of interstitial and alveolar subpopulations and identifies tumor-specific cross-talks occurring in the malignant stem epithelial compartment. A, UMAP cluster distribution of macrophages from healthy lungs (n = 3, dark blue), Vehicle- (n = 10, red), and Unesbulin-treated tumors (n = 3, light blue), up to 30 days. B, Split UMAP distribution of the nine macrophage transcriptional clusters (C0–C8) identified in healthy lungs (left), Vehicle- (middle), and Unesbulin-treated tumors (right). Each color represents a defined transcriptional cluster. C, Histograms representing macrophage cluster percentage distribution per sample (healthy lungs in blue, Vehicle- and Unesbulin-treated tumors in red and light blue, respectively). D, Histograms representing the percentages contribution of macrophage clusters per sample (healthy lungs, Vehicle- and Unesbulin-treated tumors). E, KEGG analysis of identified signaling pathways differentially enriched in selected macrophage clusters (C0 and C2). F, Heat map showing AM and IM expressed genes in healthy macrophage clusters. UMAP plot representing the expression of the representative category-specific signature in AM (G) and IM (H). I and J, Heat maps showing the predicted interactions between AM clusters and START in Vehicle- (red) and Unesbulin-treated tumors (light blue). K, Sankey plot of the protumorigenic phenotypes promoted on START by alveolar C0 macrophage-secreted ligands (left) and on macrophages by START secreted ligands (right). L and M, Heat maps showing the predicted interactions between IM clusters and START in Vehicle- (red) and Unesbulin-treated tumors (light blue). N, Sankey plot of the protumorigenic phenotypes promoted on START by C2 IM-secreted ligands (left) and on macrophages by START secreted ligands (right).


