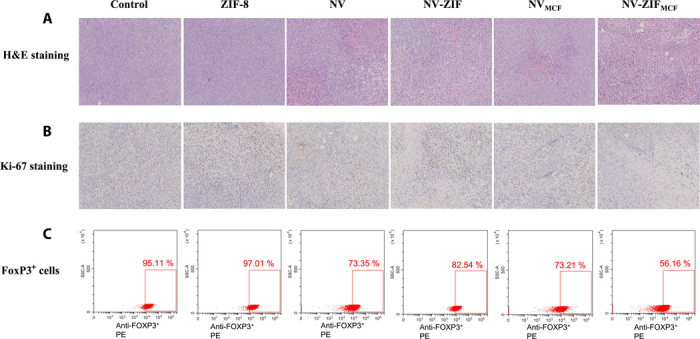
Fig. 7. Immunohistochemical analysis of the tumor sections.

(A) H&E staining and (B) Ki-67 staining of the sacrificed cancer tissues after various treatments for 21 days. (C) Representative flow cytometry plots showing FoxP3+ regulatory T cells.

(A) H&E staining and (B) Ki-67 staining of the sacrificed cancer tissues after various treatments for 21 days. (C) Representative flow cytometry plots showing FoxP3+ regulatory T cells.