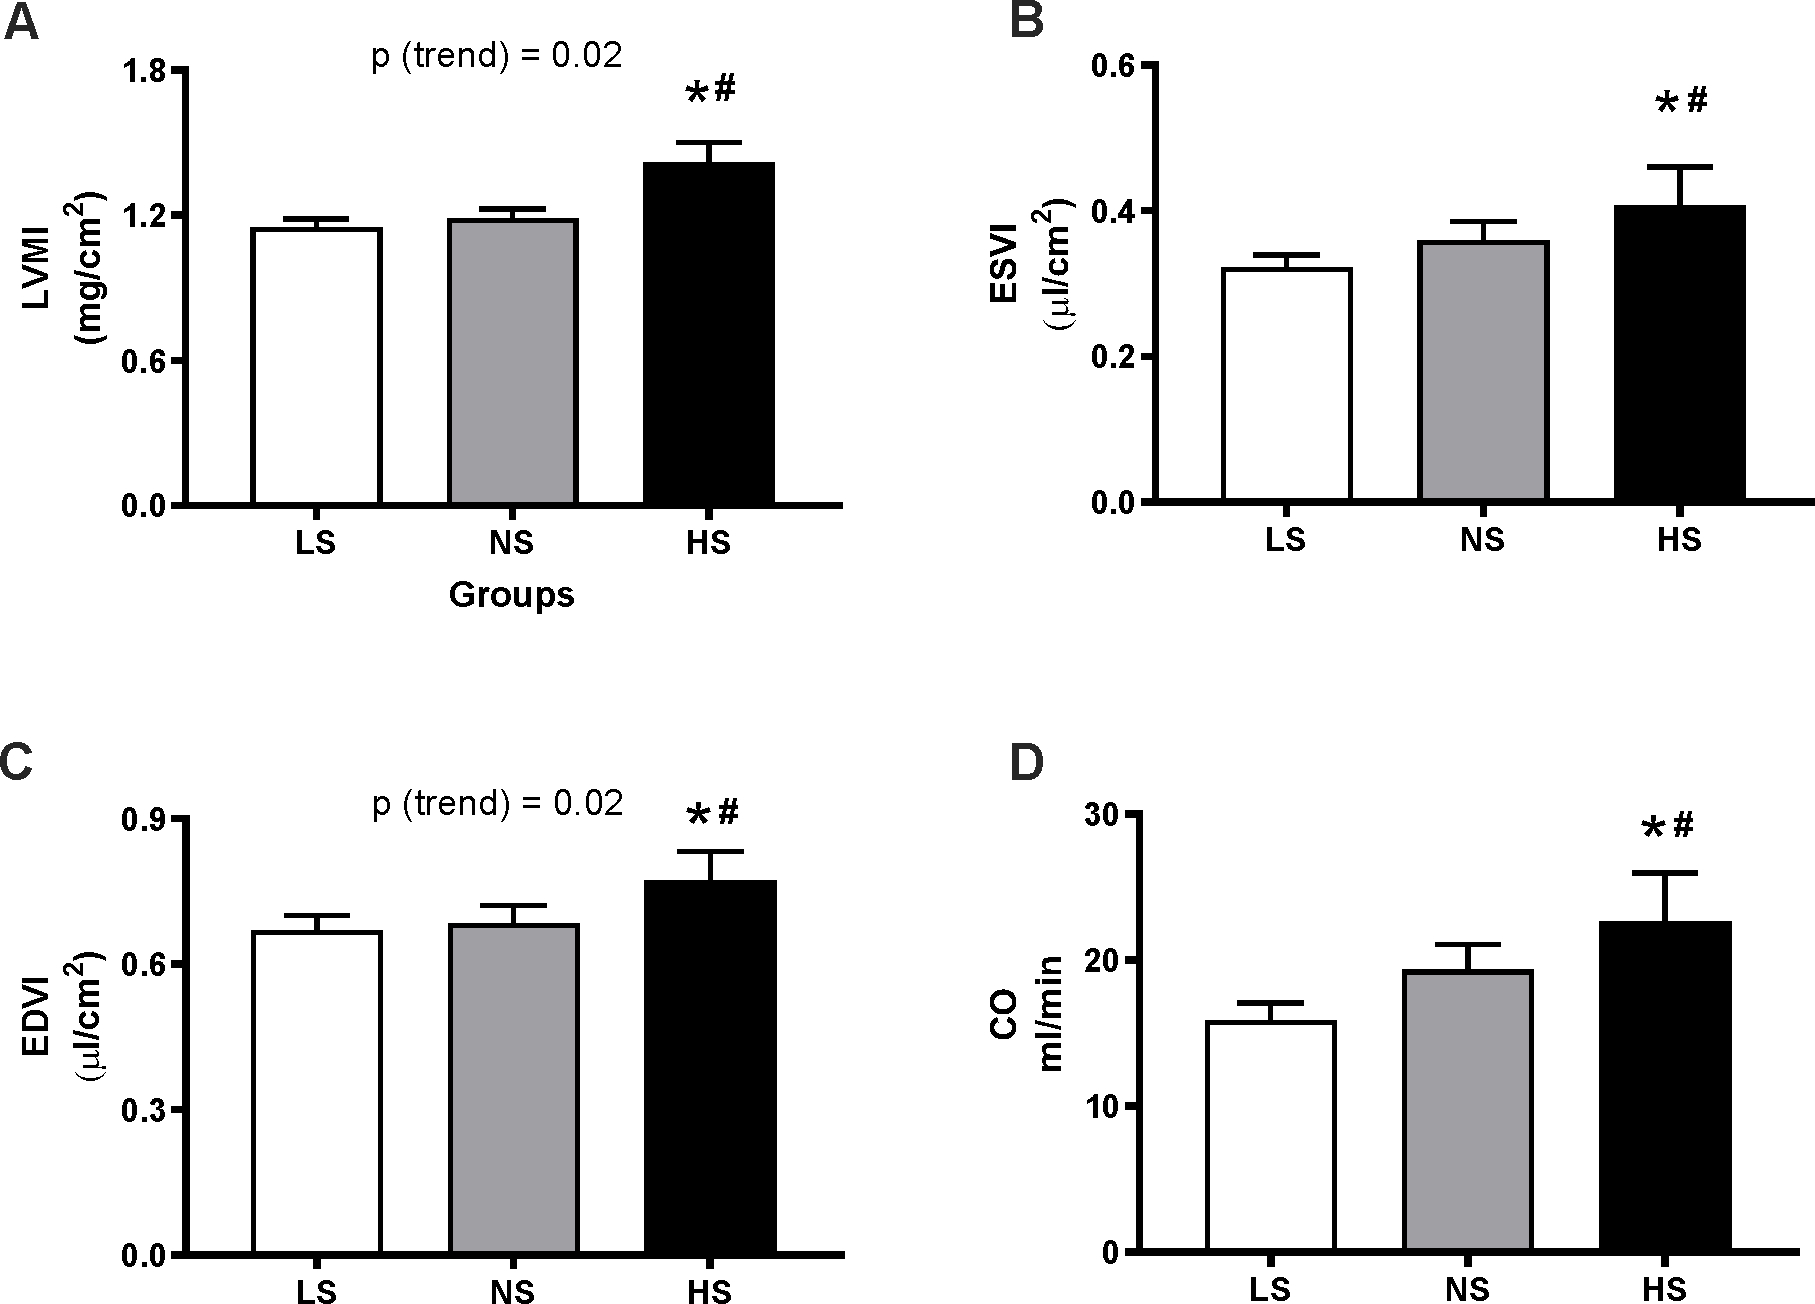
Figure 3. Effect of long-term dietary sodium on echocardiographic measures.

Mice underwent cardiac ultrasonography after 13 months of LS, NS or HS diet. Panels show the left ventricular mass index (LVMI, A), end-systolic volume index (ESVI, B), end-diastolic volume index (EDVI, C) and cardiac output (CO, D). Data are presented as mean ± SEM. *P<0.05 vs LS, #P<0.05 vs NS. P(trend) was obtained from simple linear regression analyses, using the level of sodium in the diets as independent variable, as described in the Methods.
