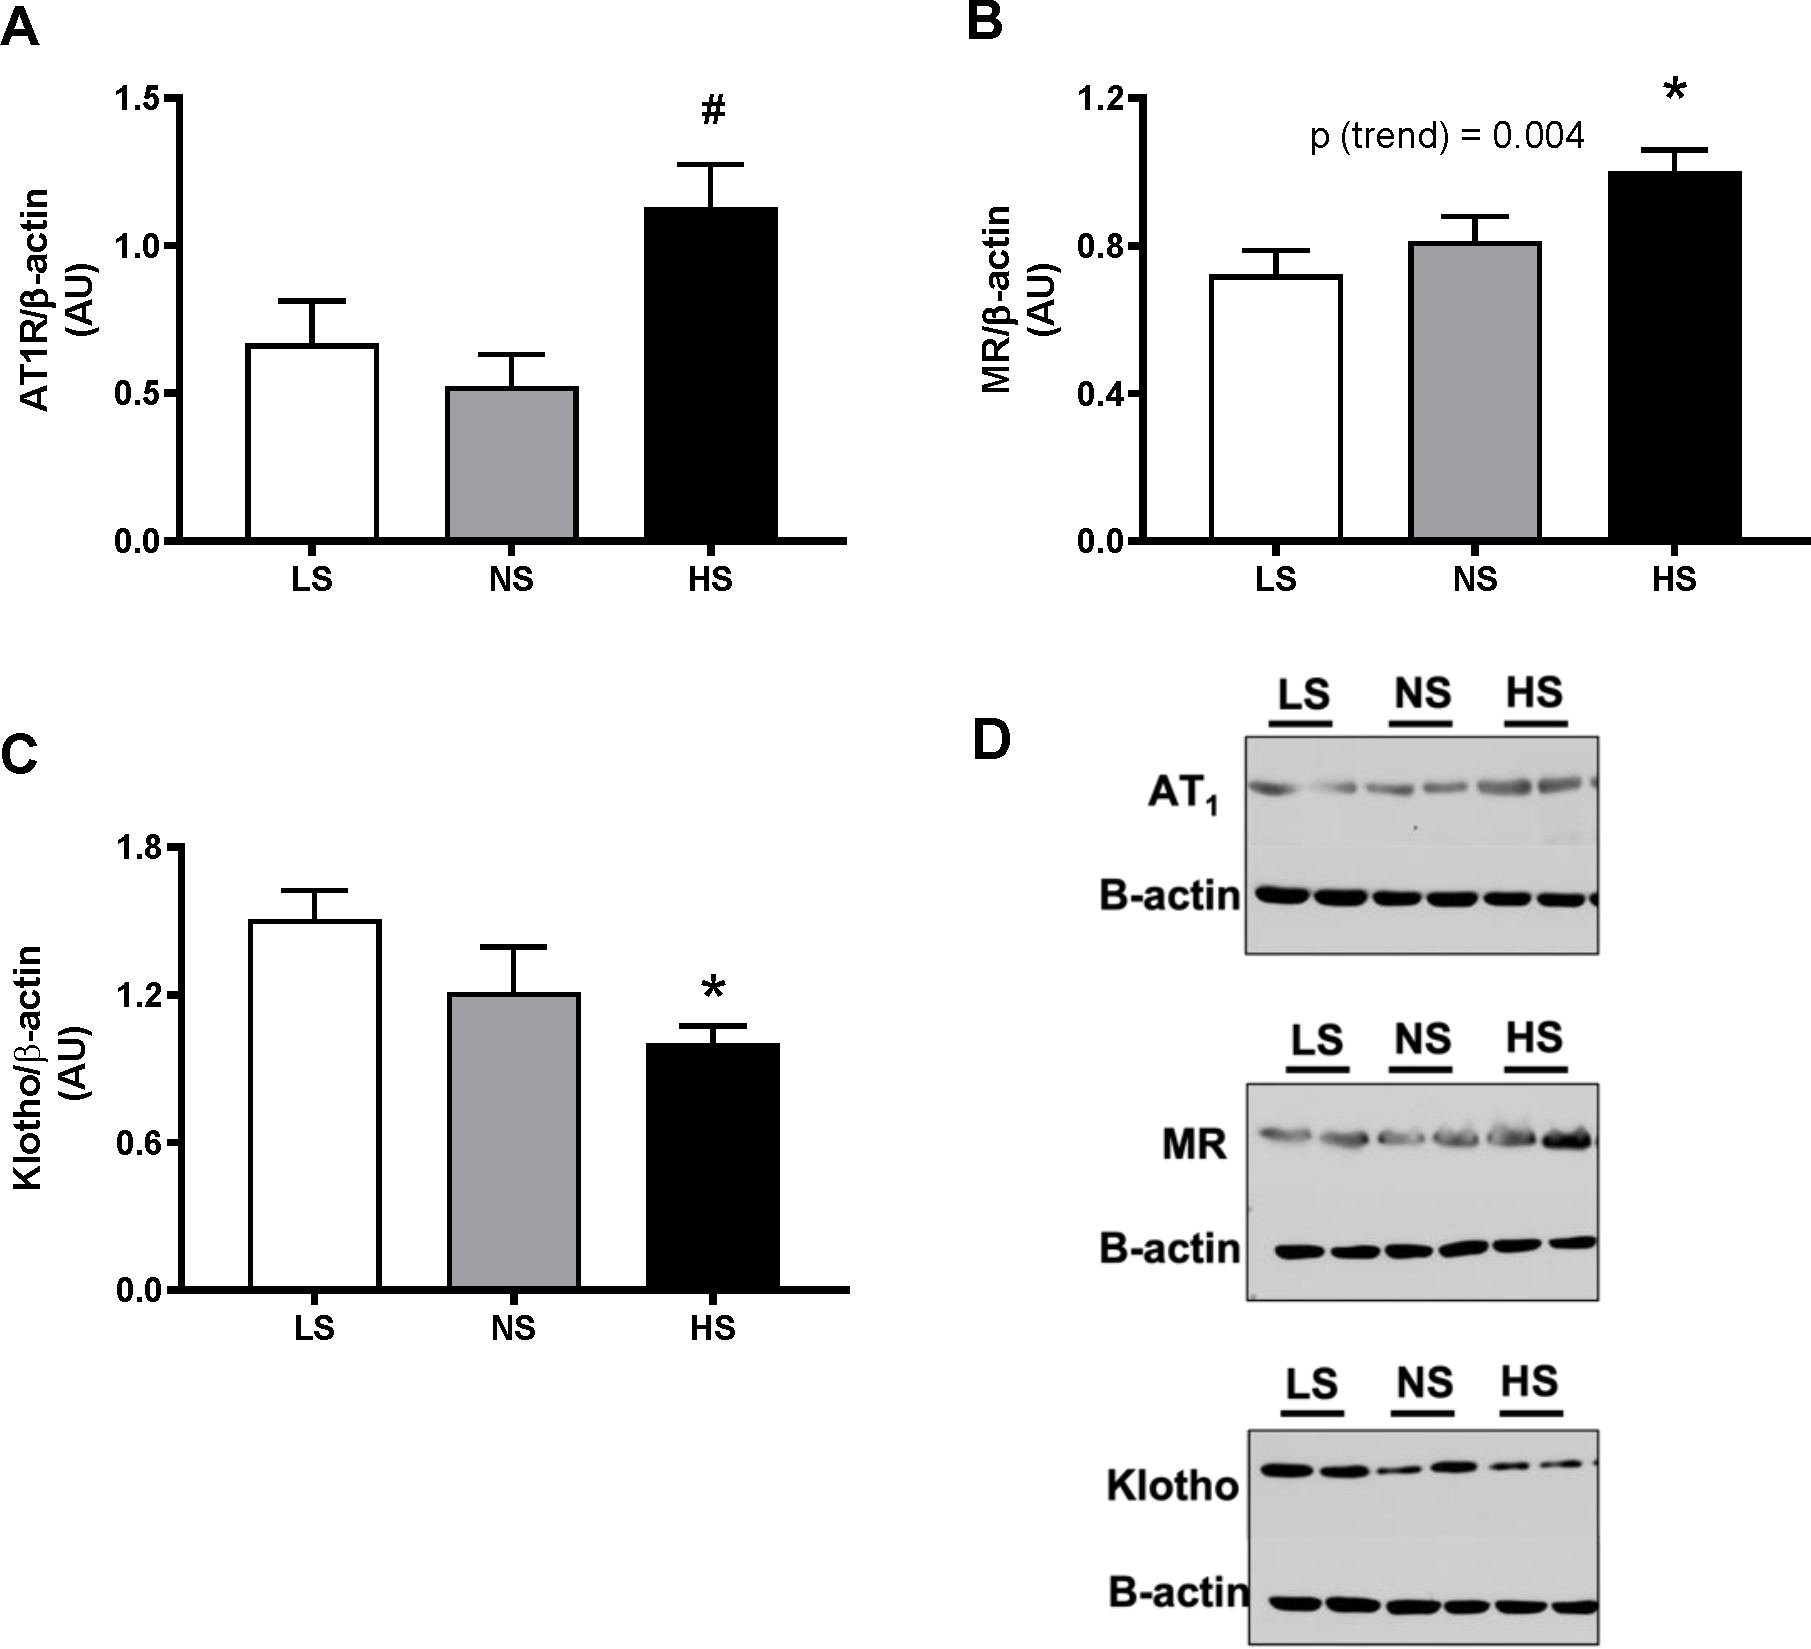
Figure 6. Effect of long-term dietary sodium on renal molecular marker expressions.

Mouse kidney cortex tissues were collected after 13 months of LS, NS or HS diet, and assessed for levels of AT1R (A), AT2R (B), Klotho (C) and MR (D) by Western blot, as described in Methods. *P<0.05 vs LS, #P<0.05 vs NS. P(trend) was obtained from simple linear regression analyses, using the level of sodium in the diets as independent variable, as described in the Methods.
