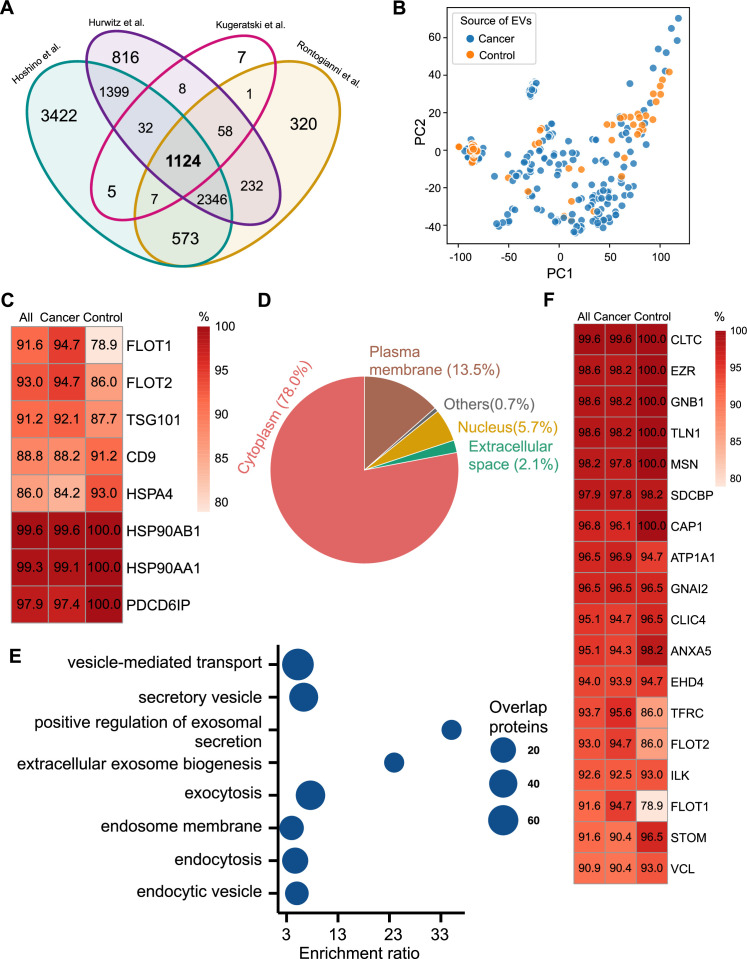
Figure 2. Proteomic characterization of exosomes derived from 285 cell lines from four studies.
(A) Overlapped proteins from four different studies of cell-line-derived exosomes. (B) PCA plot of cancer and control cell line-derived exosomes. (C) Positivity for eight commonly used exosomal protein biomarkers in various cell lines. The percentage of samples expressing each protein is shown in the boxes. Darker red indicates a higher percentage. (D) Annotation of the proteins detected in more than 90% of all samples. (E) GO and KEGG pathway enrichment analysis of the proteins detected in more than 90% of all samples. (F) Plasma membrane proteins detected in more than 90% of all samples.

