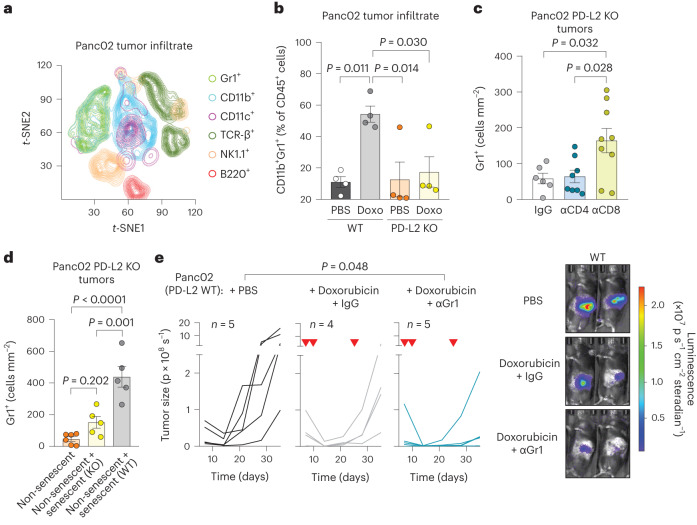
Fig. 3. Recruitment of tumor-promoting myeloid cells is prevented in PD-L2 KO after doxorubicin treatment.
a, t-distributed stochastic neighbor embedding (t-SNE) plot including the different tumor-infiltrating immune subpopulations detected using mass cytometry. The plot shows the pooled data for a total of 16 mice corresponding to four experimental groups (n = 4 mice for WT and PD-L2 KO, untreated or treated with doxorubicin). Doxorubicin (4 mg kg−1) treatment was administered on days 7 and 10, and samples were obtained on day 12. b, Quantification of the percentage of CD11b+Gr1+ cells, relative to total CD45+ cells, measured using mass cytometry. n = 4 tumors for each experimental group. Doxo, doxorubicin. c, Quantification of Gr1+ cells in sections of PD-L2 KO tumors treated with doxorubicin on days 7 and 10, subject to depletion of CD4+ (n = 8 mice) or CD8+ (n = 9) T cells (100 μg per injection, every 3 days from day 3) or the same dose of IgG (n = 6) isotype control, and collected on day 28. d, Quantification of Gr1+ cells in sections of tumors generated by the coinjection of non-senescent (n = 6 mice) PD-L2 KO Panc02 cells in combination with senescent Panc02 cells, either WT (n = 5) or PD-L2 KO (n = 5), evaluated 6 days after tumor cell injection. e, Representative quantification and images of tumor growth for PD-L2 WT tumors, untreated or treated with doxorubicin (4 mg kg−1) on days 7, 10 and 24, including an additional group treated with anti-Gr1 blocking antibody (200 μg per injection, started on day 3 and continued twice weekly) or the same dose of IgG isotype control (n = 4,5 mice per group). Inverted red triangles indicate day of doxorubicin treatment. Luminescence units are p s−1 in the graphs and p s cm−2steradian in the images. Data are presented as mean ± s.e.m. A one-way ANOVA with Tukey post-hoc test was used.

