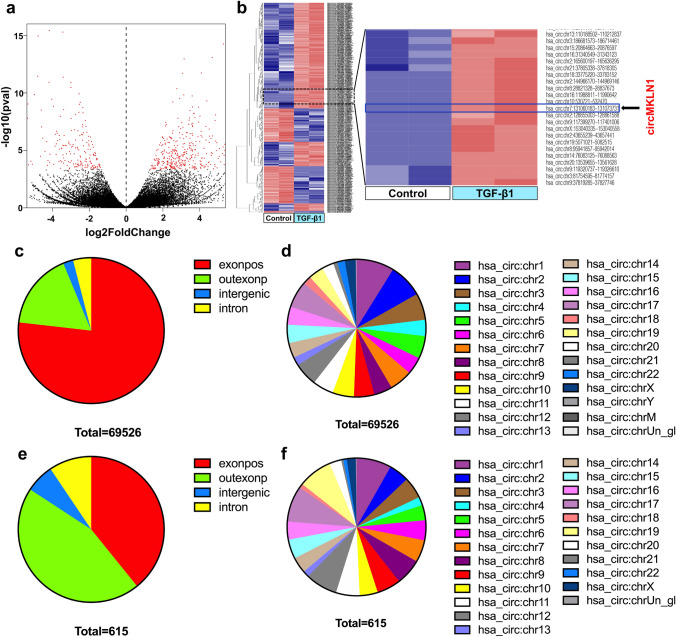
Fig. 1.
CircRNA expression profile in TGF-β1-treated AECs by high-throughput sequencing. a Statistical volcano plot of differentially expressed circRNAs. b Cluster analysis map of differentially expressed circRNAs. The red box represents circRNAs with low expression, and the blue box represents circRNAs with high expression. c Total circRNA composition in terms of gene distribution. d The distribution of total circRNAs on the chromosomes. e Differentially expressed circRNA composition in terms of gene distribution. f The distribution of differentially expressed circRNAs on the chromosomes

