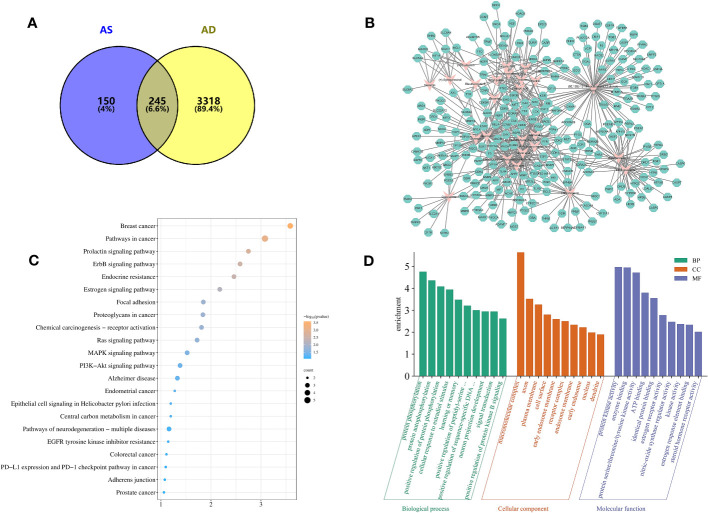
Figure 2.
Target information and network topology analysis results of Acanthopanax senticosus (AS) and Alzheimer’s disease. (A) Venn diagram. (B) “Compound–target” network (CTN) of common targets and compounds in AS. Pink rhombus, compounds; green polygons, targets. (C) Kyoto Encyclopedia of Genes and Genomes pathways enrichment analysis. The bluer the color, the larger the P value. The size of each bubble reflects the number of genes enriched in the terms. (D) Gene Ontology enrichment analysis.

