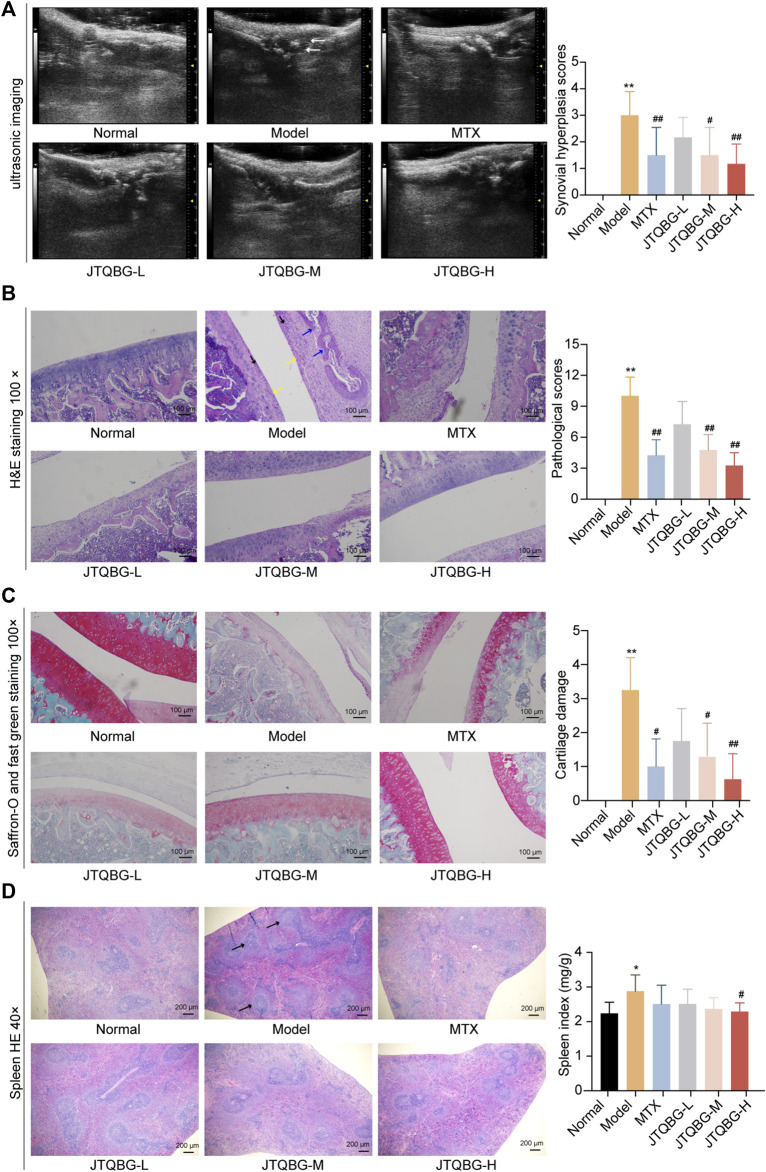
FIGURE 3.
Therapeutic effects of JTQBG on the joint and spleen. (A) Representative images of joint ultrasonic imaging and synovial hyperplasia score. Synovial hyperplasia was marked by white arrows. (B) Representative images of H&E staining of knee joints and pathological scores. Inflammatory cells were marked by black arrows. Synovial hyperplasia was marked by yellow arrows. Cartilage erosion was marked by blue arrows. Scale bar: 100 μm. (C) Representative images of Saffron-O and fast green staining of knee joints and cartilage damage scores. Scale bar: 100 μm. (D) Representative images of H&E staining in spleens and spleen index. White pulp was marked by black arrows. Scale bar: 200 μm *p < 0.05, **p < 0.01, compared with the Normal group; #p < 0.05, ##p < 0.01, compared with the model group. UBM: Ultrasound Biomicroscopy.

