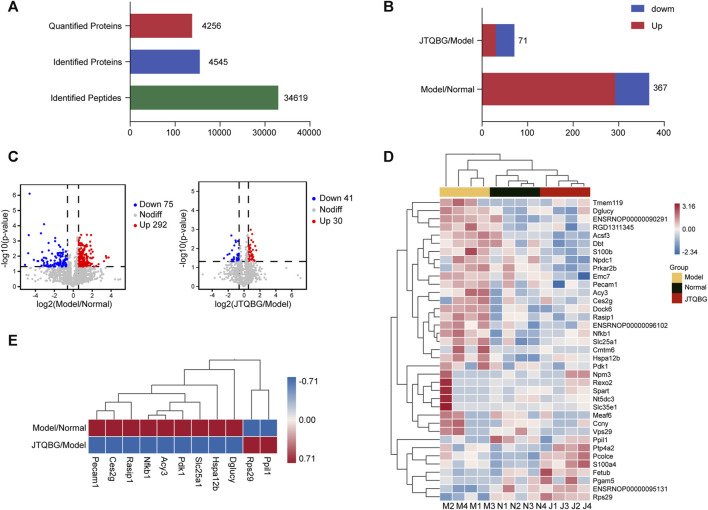
FIGURE 4.
Identification of DEPs in Model/Normal and JTQBG/Model rats. (A) Basic statistics of the MS results. (B) The distribution of differentially expressed proteins (DEPs) in different comparison groups. (C) Volcano plot of DEPs. (D) Hierarchical clustering heatmap of DEPs. Changed proteins (right side) and the samples in different groups (bottom). The color from red to blue shows the relative intensity of the DEPs. (E) Ten DEPs in the Model/Normal group were reversed in the JTQBG/Model group. Model/Normal: Model group versus Normal group; JTQBG/Model: JTQBG group versus Model group.

