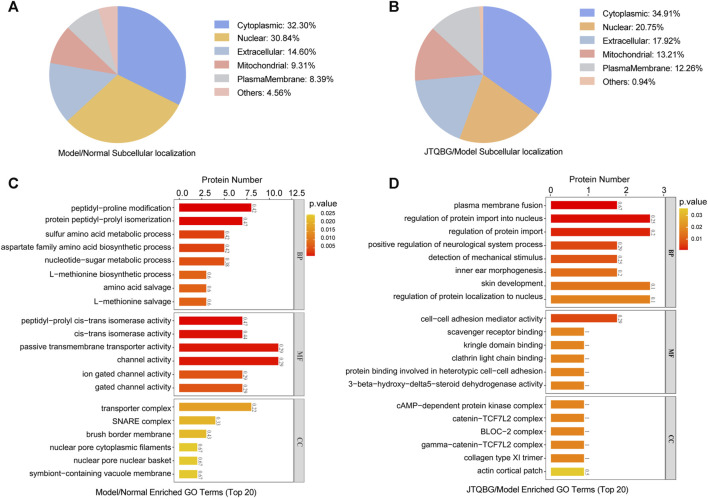
FIGURE 5.
Classification of DEPs based on GO and subcellular localization. (A and B) Subcellular localization chart of DEPs in the Model/Normal group and JTQBG/Model group. (C and D) GO enrichment of DEPs in the Model/Normal group and JTQBG/Model group. The x-axis represents the biological process (BP), cellular component (CC), and molecular function (MF). The y-axis represents gene numbers.

