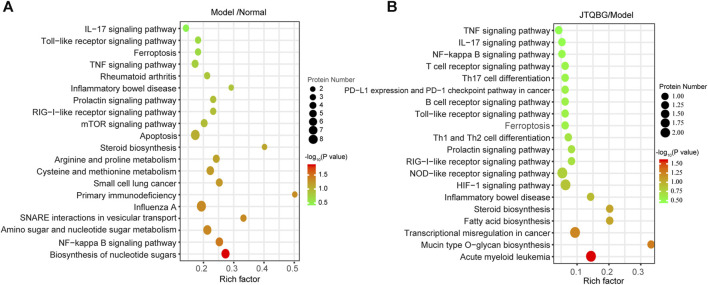
FIGURE 6.
KEGG enrichment analysis and validation of NF-κB1 signaling pathway regulation. (A and B) KEGG pathway enrichment bubble of DEPs in the Model/Normal group and JTQBG/Model group. The circle color indicates the enrichment significance p-value, while the circle size indicates the number of DEPs in the KEGG pathway.

