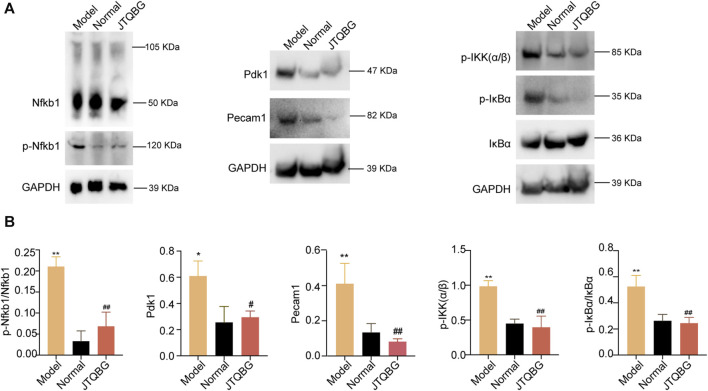
FIGURE 7.
The protein modulation of Nfkb1, p-Nfkb1, Pecam1, Pdk1 and the NF-κB1 signaling pathway. (A) Representative Western blot images. (B) Semiquantitative analysis of Western blot in different groups. *p < 0.05, **p < 0.01, compared with the Normal group; #p < 0.05, ##p < 0.01, compared with the Model group.

