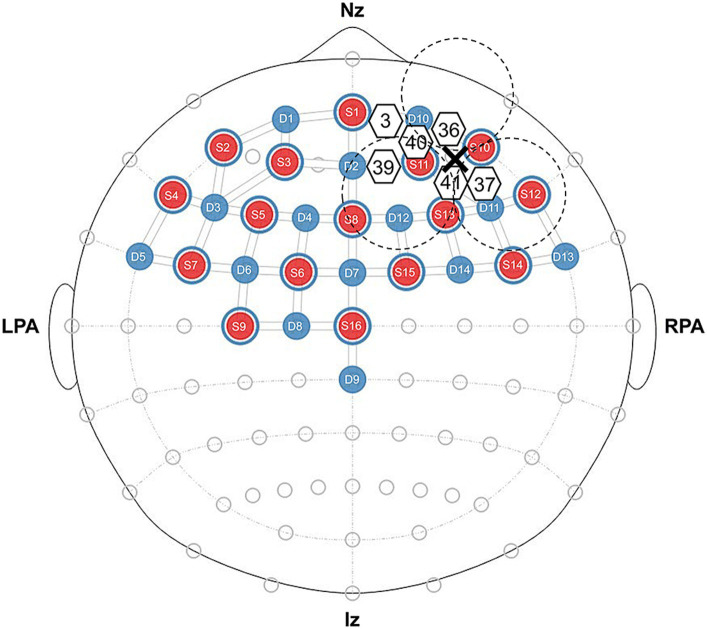
Figure 1.
Near-infrared spectroscopy probe layout, regions of interest, and configuration diagram for real or sham tSMS. We present the source in red and the detector in blue, and we denote ROI channels using white-bordered numbers. The positioning of real and sham tSMS is depicted using dashed lines with a cross representing the center of the magnet.

