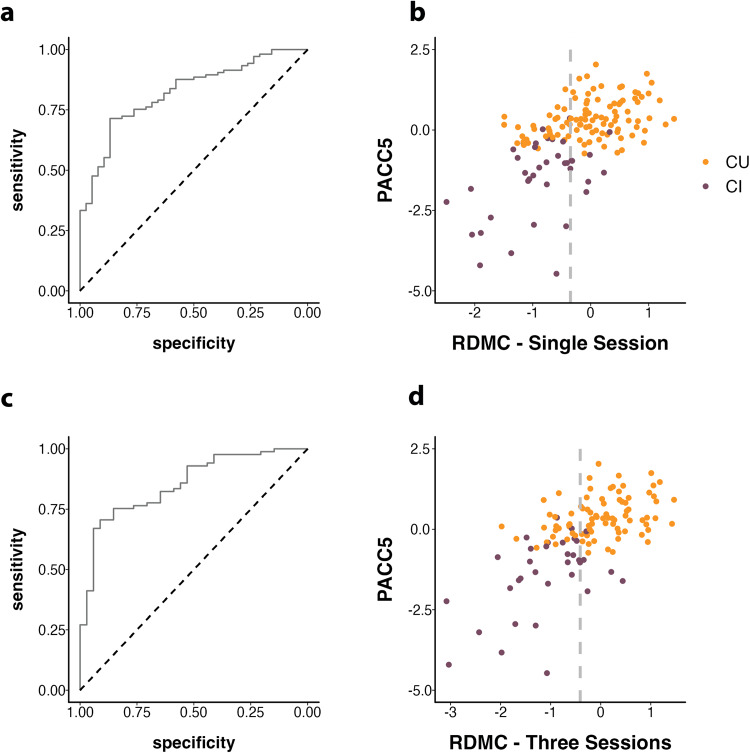
Fig. 4. Diagnostic accuracy across Single Session and Three Session scenarios.
a, c Receiver operating characteristic (ROC) curve showing diagnostic accuracy for the detection of MCI-grade cognitive impairment based on the RDMC. b, d Scatter plot showing the optimal RDMC cut-off with CU and CI in different colors—optimal cut-offs at −0.35 and −0.41 indicated by the dashed gray line, dots to the left are classified as cognitively impaired, and dots to the right as cognitively unimpaired. Information is shown for the single-session scenario (i.e., one session of each paradigm) and the three-session scenario.

