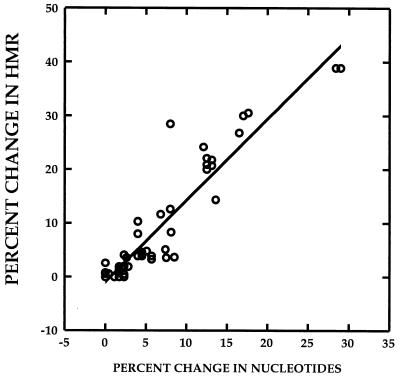
FIG. 1.
Estimation of percent change in genetic diversity between two time points, using heteroduplex analysis. The correlation between percent change in HMR and percent change in nucleotide sequence of quasispecies major variants between two time points is depicted. The r value for the correlation was 0.941 (P < 0.01). The data were derived from 60 paired specimens for which both HMR and nucleotide sequence data were available. Of the 60 measurements, 12 were derived from pairs of ISDR clones and 48 were derived from pairs of HVR1 clones.

