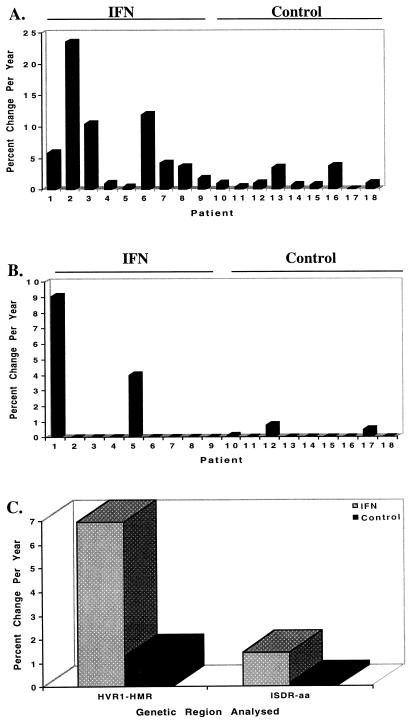
FIG. 6.
Summary of the changes in rate of fixation of mutations in the HVR1 and ISDR for IFN-treated patients 1 to 9 and untreated control patients 10 to 18. (A) Changes in the HVR1, expressed as the percent change in HMR per year; (B) changes in the ISDR, expressed as the percent change in amino acids per year; (C) summary graph comparing changes in both the HVR1 and ISDR for the IFN-treated and control patient populations. For the HVR1, the average values for IFN-treated and control patients were 6.97 and 1.31% percent change in HMR per year, respectively (P = 0.019); for the ISDR, the average values for IFN-treated and control patients were 1.45 and 0.15% change in amino acids per year, respectively (P = 0.12).

