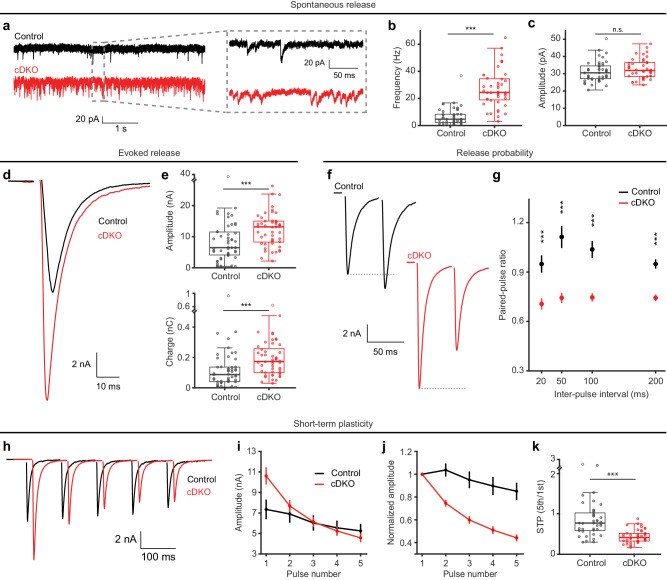
Fig. 1. Tomosyn cDKO synapses are stronger and depress faster.
a–c Analysis of spontaneous vesicle release in autaptic hippocampal neurons. Control n = 47/6, cDKO n = 44/6. a Example traces of miniature EPSCs (mEPSCs). b The frequency of mEPSCs (***p < 0.0001). c mEPSC amplitude (p = 0.0832). d–e Analysis of evoked synaptic transmission. Control n = 50/6, cDKO n = 49/6. d Example traces of evoked synaptic transmission. e Quantification of evoked EPSC amplitude (***p = 0.0001) and charge (***p = 0.0002). See Supplementary Fig. 2a–c for quantifications of EPSC kinetics. f, g Release probability was tested by applying paired pulses with multiple inter-pulse intervals (IPIs). 20 ms IPI: control n = 45/6, cDKO n = 47/6. 50 ms IPI: control n = 37/6, cDKO n = 42/6. 100 ms IPI: control n = 39/6, cDKO n = 44/6. 200 ms IPI: control n = 47/6, cDKO n = 47/6. f Example traces of paired pulses stimulated with a 50 ms IPI. g The paired-pulse ratio (PPR) was calculated by dividing the amplitude of the second pulse by the amplitude of the first pulse; (***p < 0.0001). See Supplementary Fig. 2d for boxplots per IPI. h–k Short-term plasticity (STP) was analyzed by stimulation of five consecutive pulses at 10 Hz. Control n = 47/6, cDKO n = 47/6. h Example traces. i Absolute EPSC amplitudes over the 5 pulses. j STP illustrated by normalizing amplitudes to the first pulse. k STP quantified by the ratio of the fifth pulse over the first pulse; (***p < 0.0001). N = cells/independent cultures. In (b, c, e, k), boxplots display median (center), upper and lower quartiles (box bounds) and whiskers to the last datapoint within 1.5x interquartile range. In (g, i, j), data are presented as mean ± SEM. A one-way ANOVA tested the significance of adding experimental group as a predictor, see Supplementary Table 1. Abbreviations: n.s. (not significant). See also Supplementary Figs. 1–4. Source data are provided as a Source Data file.

