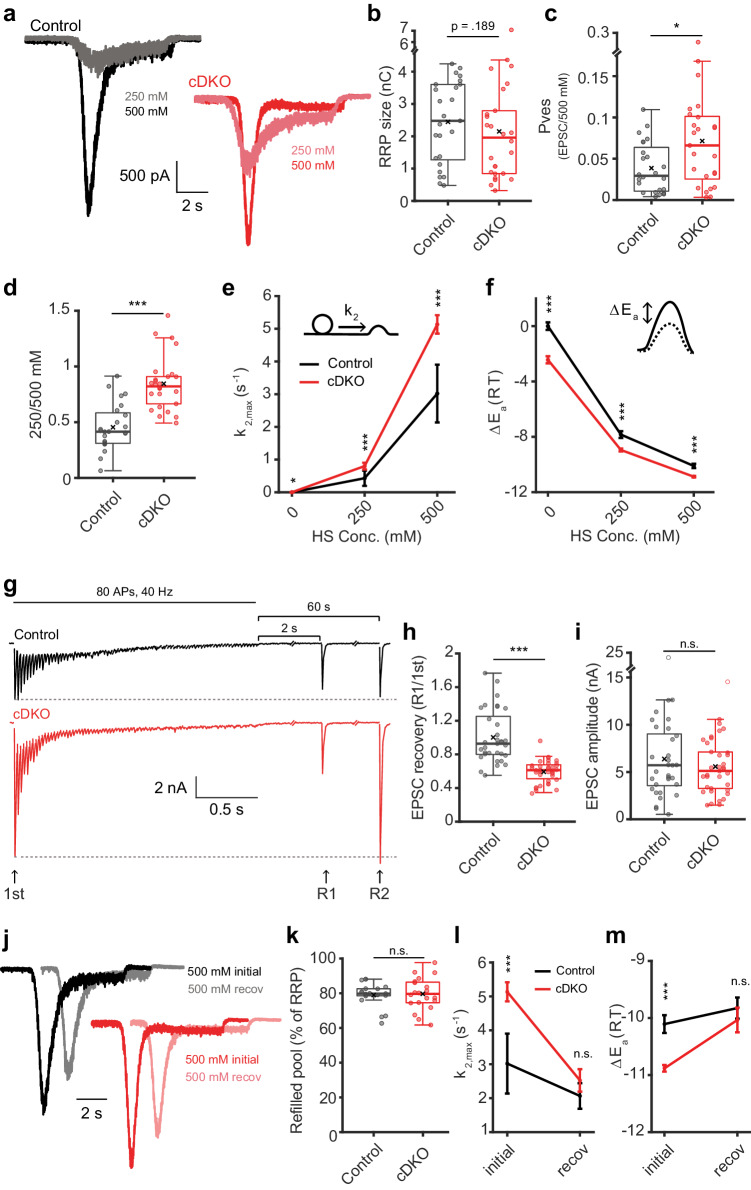
Fig. 2. Tomosyns increase the energy barrier for vesicle fusion.
a Example responses to sucrose application. b RRP released by 500 mM sucrose. Control n = 25/6, cDKO n = 26/6; p = 0.1894. c The fraction of the RRP released by an EPSC. Control n = 24/6, cDKO n = 25/6; *p = 0.0137. d The fraction of the RRP released by 250 mM sucrose. Control n = 25/6, cDKO n = 26/6; ***p < 0.0001. e, f Sucrose traces were fitted to a minimal vesicle state model. 0 mM (rest): control n = 13/6, cDKO n = 7/6; 250 mM: control n = 12/6, cDKO n = 17/6; 500 mM: control n = 16/6, cDKO n = 18/6. See Supplementary Fig. 5a. e Fitted maximal fusion rate constant (k2,max(s-1)); *p = 0.02436 (0 mM); ***p = 0.0001 (250 mM); ***p < 0.0001 (500 mM). f The change in activation energy (ΔEa) in relation to control neurons at rest, calculated from k2,max(s−1), reflecting the change in the energy barrier upon stimulation. ***p = 0.0004 (0 mM); ***p = 0.0001 (250 mM); ***p < 0.0001 (500 mM). g–i RRP-depleting stimulus followed by recovery pulses after 2 (R1) and 60 (R2) seconds. Control n = 33/6, cDKO n = 38/6. g Example traces. h Fraction of 1st EPSC amplitude recovered at R1; ***p < 0.0001. i Absolute R1 amplitude; p = 0.4889. See Supplementary Fig. 5j-k for R2. j–m A second 500 mM sucrose applications (recov) was given after 30 s. j Normalized example traces. k Refilled pool as percentage of initial RRP. Control n = 19/6, cDKO n = 20/6, p = 0.6347. l The fusion rate and (m) the change in the activation energy. Initial: corresponds to (e–f). Recov: control n = 12/6, cDKO n = 11/6; p = 0.4030 (k2,max(s−1)); p = 0.4182 (ΔEa). N = cells/independent cultures. In (b, c, d, h, i, k), boxplots display median (center), upper and lower quartiles (box bounds) and whiskers to the last datapoint within 1.5x interquartile range. In (e, f, l, m), data report mean ± SEM. A one-way ANOVA tested the significance of adding experimental group as a predictor, see Supplementary Table 1. Abbreviations: n.s. (not significant), HS (hypertonic sucrose). See also Supplementary Figs. 5, 6. Source data are provided as a Source Data file.

