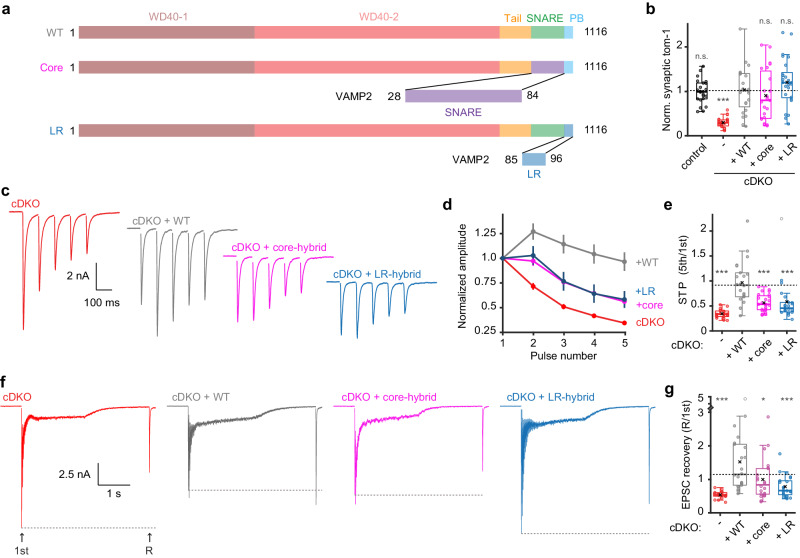
Fig. 8. The polybasic domain contributes to the reduced functionality of the VAMP2-hybrid.
a Schematic representation of mutant constructs created to test the individual contributions of the linker region and the SNARE motif to the lack of interchangeability of the corresponding regions in tomosyn and VAMP2. b Normalized synaptic tomosyn-1 expression. Control n = 22/4, cDKO n = 23/4, + WT n = 24/4, + Core n = 23/4, + LR n = 25/4. Post hoc comparisons against +WT: p = 0.7549 (control); ***p < 0.0001 (cDKO), p = 0.3389 (+Core), p = 0.3419 (+LR). See Supplementary Fig. 12 for example images and morphological analysis. c–e Short-term plasticity (STP) was tested by stimulation with 5 pulses at 10 Hz. cDKO n = 20/4, + WT n = 22/4, +Core n = 24/4, +LR n = 23/4. c Example traces. d Amplitudes were normalized to the first pulse. e STP is quantified by the ratio of the fifth over the first amplitude. Post hoc comparisons against +WT: ***p < 0.0001 (cDKO), ***p < 0.0001 (+Core), ***p < 0.0001 (+LR). f, g Recovery of the initial amplitude was tested by high-frequency stimulation (80 pulses at 40 Hz) followed by a recovery pulse after 2 s. cDKO n = 19/4, +WT n = 22/4, +Core n = 22/4, +LR n = 22/4. f Example traces. g Quantification of EPSC recovery (normalized to 1st). Post hoc comparisons against +WT: ***p < 0.0001 (cDKO), *p = 0.0043 (+Core), ***p < 0.0001 (+LR). N = cells/independent cultures. In (b, e, g), boxplots display median (center), upper and lower quartiles (box bounds) and whiskers to the last datapoint within 1.5x interquartile range. In (d), data are presented as mean ± SEM. A one-way ANOVA tested the significance of adding experimental group as a predictor, see Supplementary Table 1. For post-hoc comparison to +WT group, p-value thresholds (*<0.05; **<0.01;***<0.001) were adjusted with a Bonferroni correction (α/number of tests). Abbreviations: PB (polybasic domain); LR (Linker region); n.s. (not significant). See also Supplementary Fig. 12. Source data are provided as a Source Data file.

