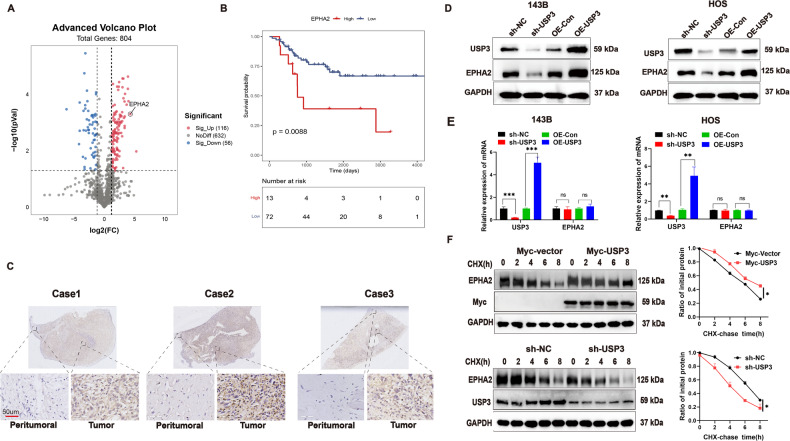
Fig. 3. USP3 promotes the stabilization of EPHA2 protein.
A. Volcano plot of the number of proteins that undergo changes in their ubiquitination levels after knockdown of USP3 expression. B. Kaplan‒Meier curve of the difference in overall survival between patients with high and low expression levels of EPHA2. The original data were obtained from the TIMER2.0 website (TIMER2.0 cistrome.org). C Representative images of IHC staining for EPHA2 in OS tissue and peritumoral tissue (scale bar, 50 µm). D Effect of knockdown or overexpression of USP3 on the expression level of EPHA2 protein in 143B and HOS cells. E Effect of knockdown or overexpression of USP3 on the mRNA expression level of EPHA2 in 143B or HOS cells. F The effect of knockdown or overexpression of USP3 on the stability of EPHA2 protein in 143B cells, which were further treated with CHX, was detected by WB. The right panels show the quantification of the EPHA2 protein levels. (Data from three independent experiments. *P < 0.05; **P < 0.01; ***P < 0.001).

