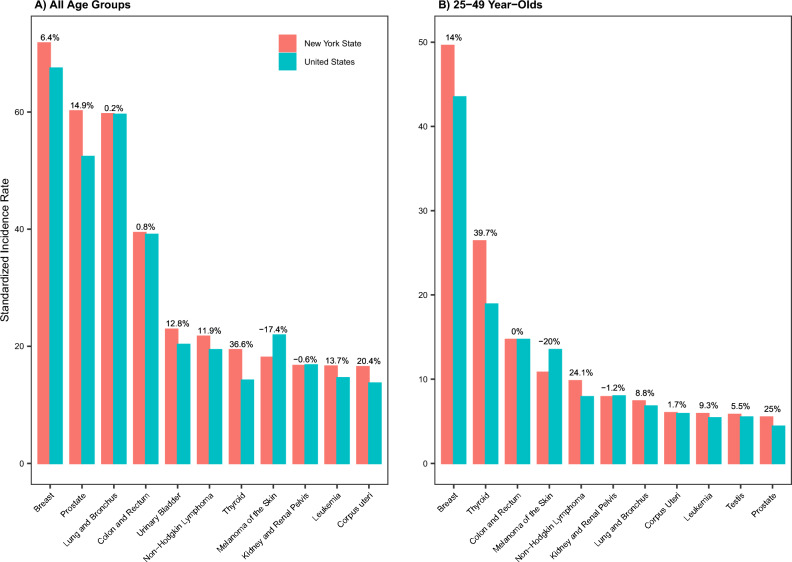
Figure 1.
Site-specific cancer incidence rates during 2010–2018 in New York State (NYS), compared to the United States (U.S.). Bar plots show age-standardized incidence rates for the 10 most prevalent cancer types in NYS, among all ages (A) and 25–49 year-olds (B), separately. Percentages next to the bars show the percentage difference compared to the U.S., computed as (incidence rate in NYS − incidence rate in the U.S.)/(incidence rate in the U.S.) × 100%; thus, positive percentages indicate higher incidence rates in NYS than the U.S. Note that 11 cancers are shown in each panel for comparison, because the 10 most prevalent cancers among all ages and among 25–49 years were not identical in NYS during 2010–2018; cancers of the prostate and urinary bladder were among the 10 most prevalent cancers for the whole population but not for 25–49 year-olds, while cancers of the corpus uteri and testis were among the 10 most prevalent cancers for 25–49 year-olds but not for the whole population.

