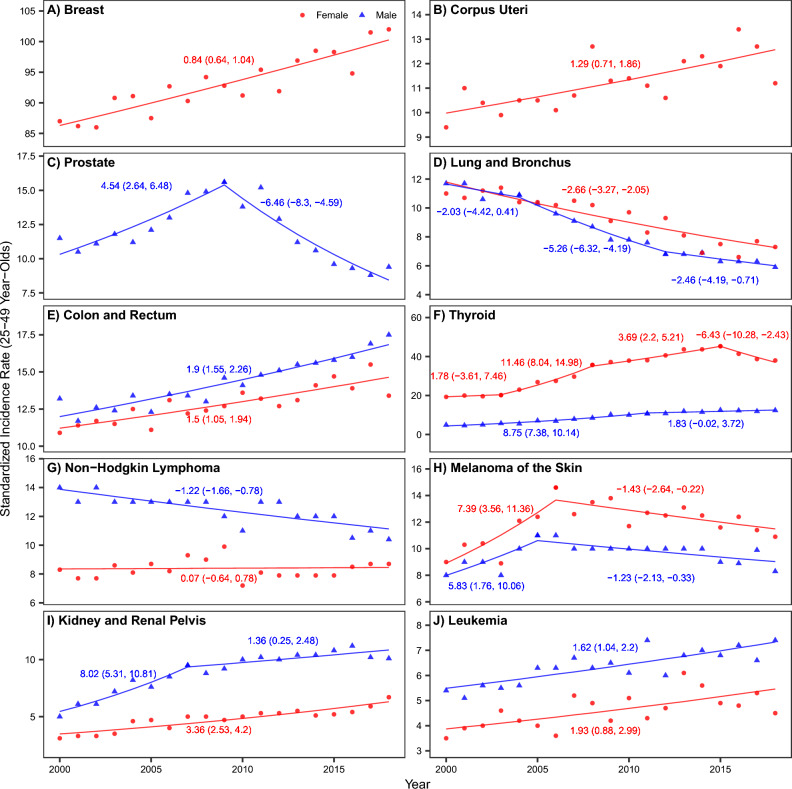
Figure 2.
Trends in cancer incidence among young adults (25–49 year-olds) in New York State (A–J) for each of the 10 common cancers). Dots (red • = women and blue ▲ = men) show annual cancer incidence rates for each cancer type (see subplot title). Line segments show time periods with different time trends, as identified by the joinpoint software; numbers next to each line segment show estimated annual percent changes (and 95% confidence intervals) for each time period (red = women and blue = men).

