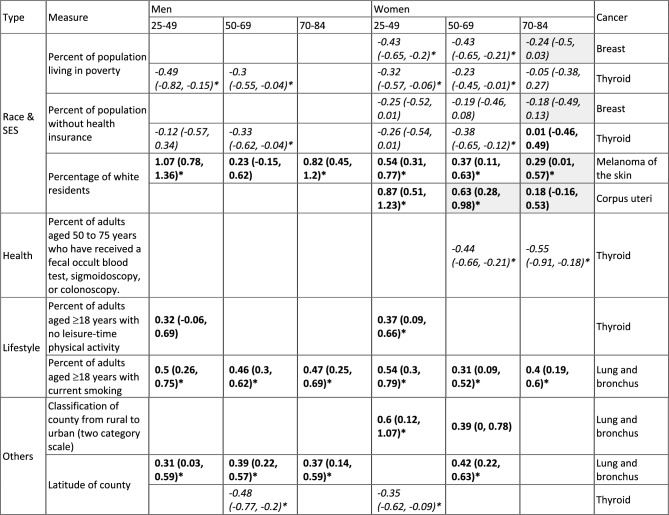
Table 3.
Common non-environmental risk factors.
All estimates here adjusted for other variables as detailed in the main text and Table 1. First column shows the type of variable; 2nd column (“Measure”) shows specific measures. The last column shows the type of cancer for which the estimates were made. The middle panel show estimated associations (see corresponding sex, and age group on the top). To allow for comparison of the magnitude of association estimates across risk factors, we standardized the variables to 0 mean and 1 standard deviation. Thus, the estimates (mean and 95% confidence intervals in parentheses) are the parameters of standardized coefficients and equivalent to adjusted correlation coefficients. Colors indicate the direction of the association (Italics = negative; Bold = positive). Asterisks (*) indicate statistically significant at a = 0.05 level. Grey cells indicate the association is from a model with an adjusted R2 < 0.3 (see Table 1 for detail). Blank cells (i.e., no estimates) indicate the measure was not identified in the best-fit model for the corresponding cancer type, sex, and age group, or not applicable for the sex-specific cancers (e.g., not estimates prostate cancer among women).

