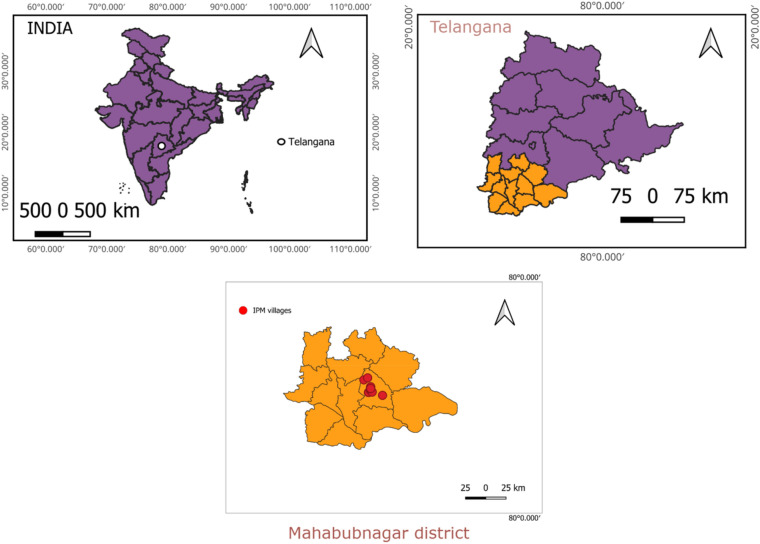
Figure 9.
GIS maps depicting the study location and IPM practicing villages (Year 2019–20: IPM1—16.5078734, 78.231732; IPM2—16.5082880, 78.228844; IPM3—16.623484, 78.1588717; IPM4—16.6463967, 78.202408; IPM5—16.4793954, 78.210666; IPM6-n16.4460255, 78.372663. Year 2020–21: IPM1—16.480701596, 78.2149810; IPM2—16.48102895, 78.21498102, IPM3—16.48056361, 78.21398727, IPM4—16.54407863, 78.23688299, IPM5—16.54439100, 78.23664425, IPM6—16.54378814, 78.23687441. Year 2021–22: IPM1—16.5067690, 78.2334704; IPM2—16.5052449, 78.2334493; IPM3—16.4866143, 78.2544631; IPM4—16.4836707, 78.2544438; IPM5—16.5233138, 78.2327685; IPM6—16.5244808, 78.2370171.)

