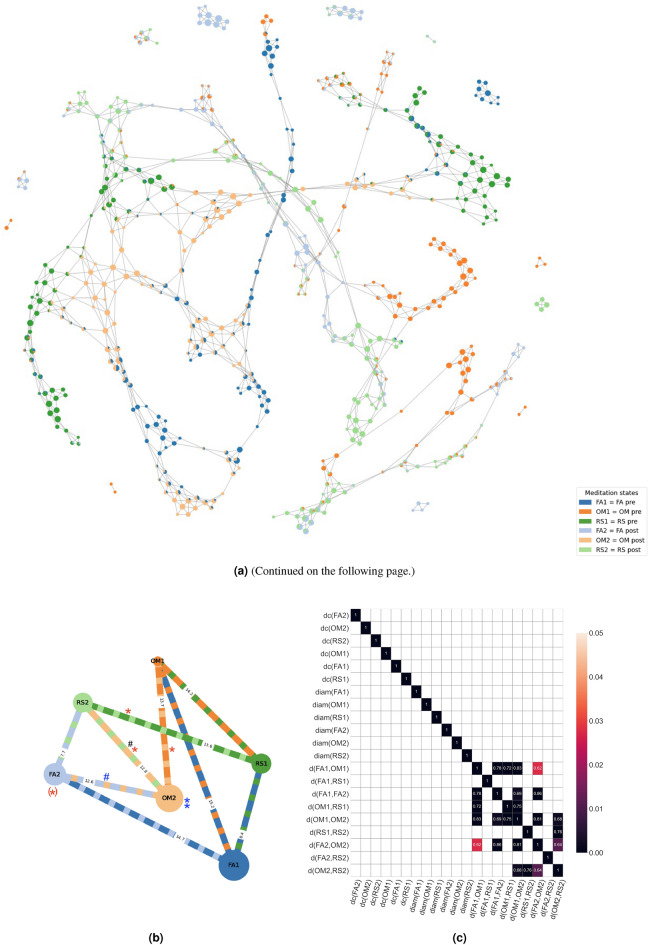
Figure 1.
(a) A representative Mapper shape graph of one subject (5119) produced with the visualization library DyNeuSR10. Each color represents the distribution of an MS (Table 1) in the subject-specific landscape of brain states. (b) The network is a schematic picture of the average topological organization of Mapper shape graphs that are shared across all subjects. The nodes are labeled according to the six meditation states (MS), (Table 1). For example, we found that the closeness centrality of the OM significantly increased postretreat, which is represented by the central position of the OM post-node. The length of the edges represents the average OT distance (over all subjects) between the MSs. For example, the OT distance between FA2 and OM2 is smaller than the OT distance between FA1 and OM1. Finally, the diameter of the node represents the diameter of the corresponding MS. Significant increases in the measurements due to retreat and drug effects are annotated by blue and red stars, respectively. Similarly, decreases are annotated by blue and red accidentals, respectively. The star in the bracket near node FA2 indicates that the effect is most likely neglectable. Two stars near OM2 indicate that two measurements (diameter and centrality) were significant. Black accidentals indicate a significant decrease in the distance for the group with low positive derealization. The detailed statistical descriptions are given below. (c) Pearson correlations of all graph measures with p values according to the color bar (corrected for 21*21 multiple comparisons). This Figure illustrates how the OT distances are strongly colinear (for topological reasons).

