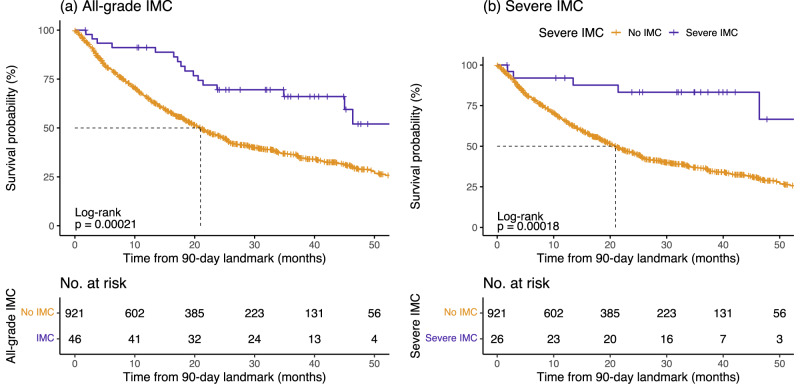
Fig. 3. Immune checkpoint inhibitor-mediated colitis (IMC) as a predictor of overall survival (OS) in the entire GeRI cohort.
a All-grade IMC and b Severe IMC. Kaplan–Meier survival curves are unadjusted with 90-day landmark and compare those who had an IMC (all-grade or severe) with those who did not have an IMC (No IMC). The p-values in the graph represent the log-rank p-values (two-sided), and the dotted line represents the median survival time. Underneath each set of curves is the number of study participants at risk beyond that time point for the IMC and No IMC groups. Source data are provided as a Source Data file.

