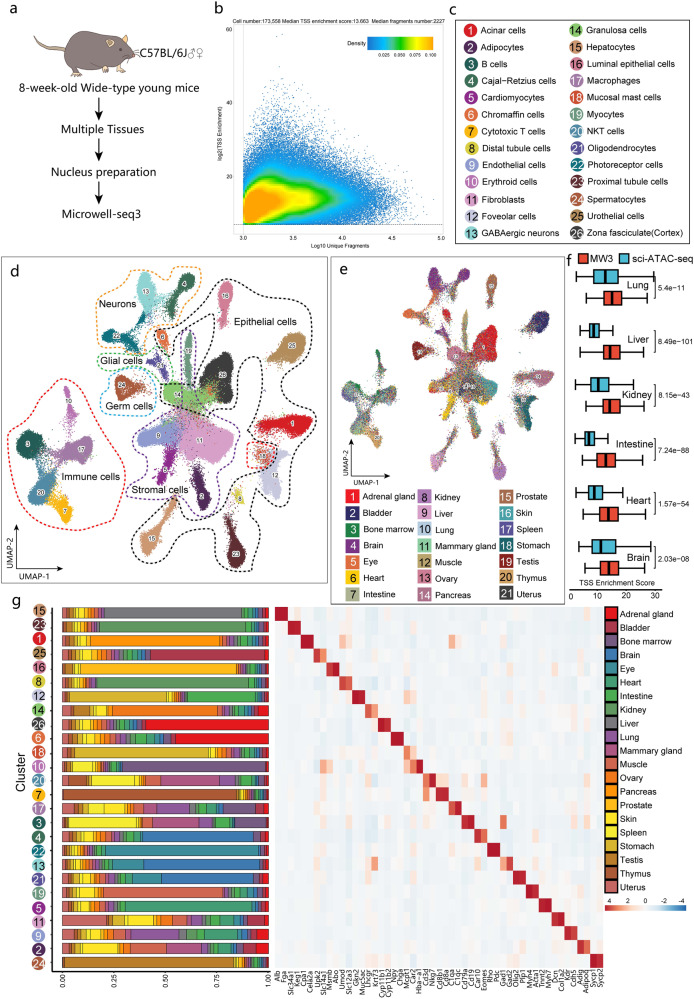
Fig. 2. Analysis of chromatin accessibility in multiple mouse tissues.
a Schematic view of the workflow. b Quality control plots generated with ArchR for all cells in the Microwell-seq3 ATAC-seq data from wild-type mice showing the TSS enrichment score and number of unique nuclear DNA fragments per cell. The dot color represents the density (in arbitrary units) of the point in the plot. c Annotations of major snATAC-seq clusters in 8-week-old wild-type mice. d UMAP plot of all major cell types from 8-week-old wild-type mice in ATAC-seq. e UMAP plot of all cell clusters from 8-week-old wild-type mice colored by tissue. f Distribution of TSS enrichment scores from Microwell-seq3 and sci-ATAC-seq data in different tissues, reads (fragments) are down sampled to 2000 fragments per nucleus. The statistical test used is a two-sided Student’s t-test. g Heatmap of differential accessibility relative to the annotated cell type. Significant highly accessible sites in relevant genes are highlighted along the bottom. The proportion of each cluster originating from each tissue is shown alongside the heatmap.

