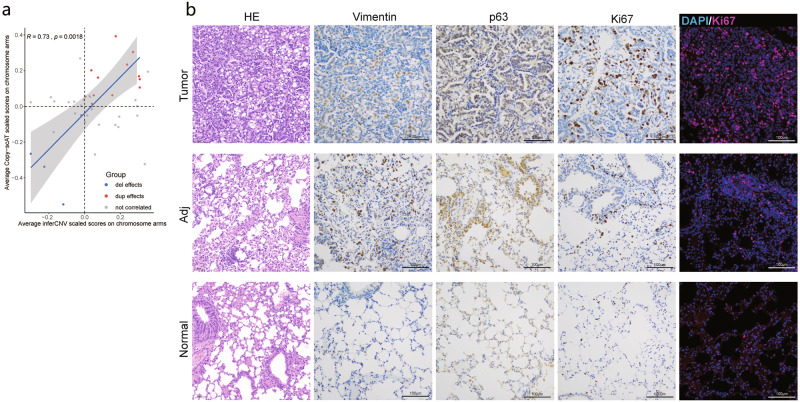
Fig. 5. CNV correlation analysis and validation of the malignant signatures.
a Correlation analysis of chromosome level CNV results between RNA-seq and ATAC-seq data. Only duplication effects (dup effect) and deletion effects (del effect) in overlapped the cytobands (chromosome region, see Materials and methods) were included for correlation analysis. Cytobands with inconsistent trend across different methods were labeled as “not correlated”. b Representative images of HE, IHC and IF staining results of tumor specific markers in tumor, tumor-adjacent tissue (Adj) and normal tissue sections. Scale bars, 100 μm.

