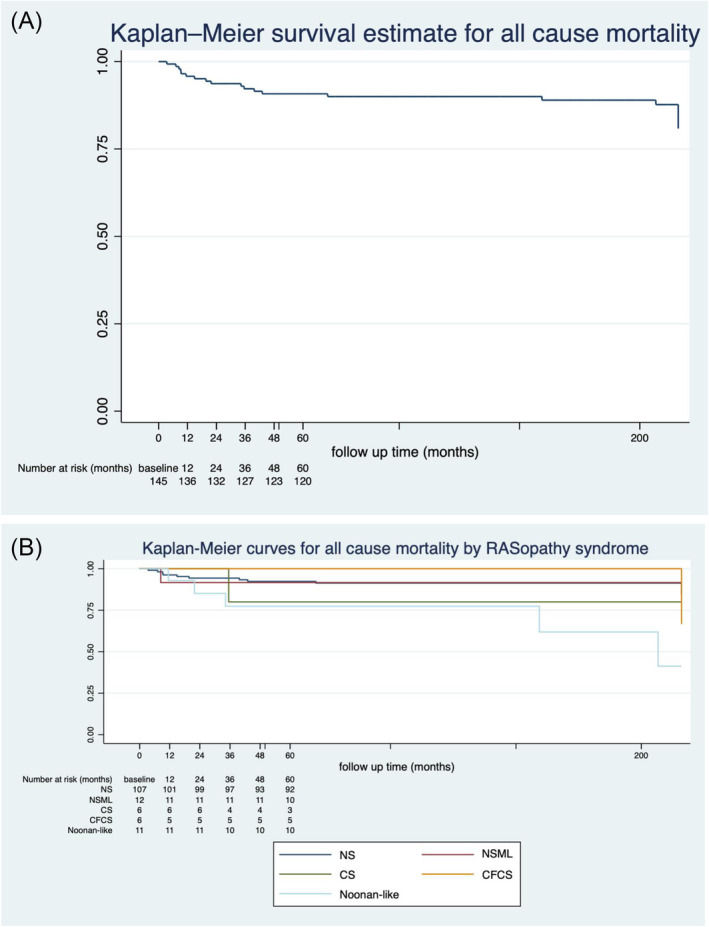
Figure 2.

Kaplan–Meier curve for all‐cause mortality with yearly numbers at risk for (A) whole cohort and (B) by different RASopathy syndromes [Noonan syndrome (NS), Noonan syndrome with multiple lentigines (NSML), Costello syndrome (CS), and cardiofaciocutaneous syndrome (CFCS)].
