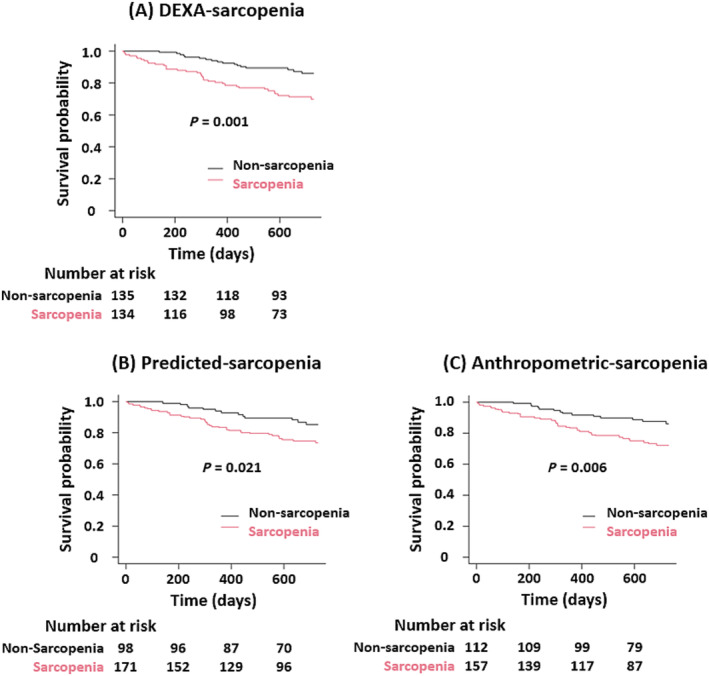
Figure 2.

Kaplan–Meier curves for all‐cause mortality between sarcopenia groups. Kaplan–Meier curves stratified by the presence or absence of sarcopenia based on (A) dual‐energy X‐ray absorptiometry (DEXA)‐sarcopenia, (B) Predicted‐sarcopenia, and (C) Anthropometric‐sarcopenia. Appendicular skeletal muscle mass index was calculated by dividing the sum of the muscle mass (MM) in the extremities by height squared (kg/m2). The cut‐off values proposed by the Asian Working Group for Sarcopenia were used to define low MM (men, ≤7 kg/m2; and women, ≤5.4 kg/m2).
