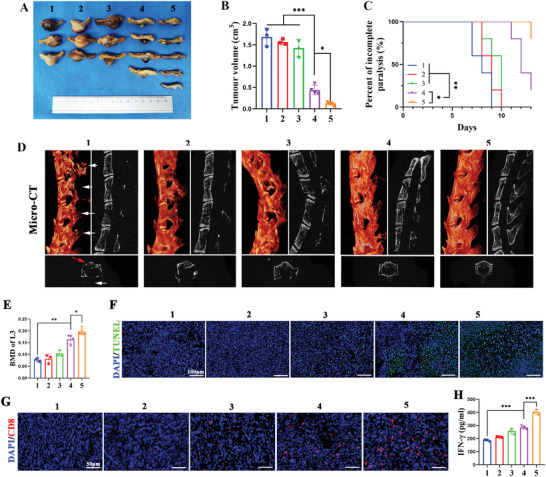
Figure 6.

Therapeutic efficacy of DHU‐CBA2 in lung cancer spinal metastasis (LC‐SM). (A–H) LC‐SM tumors by various treatments (1: CTRL; 2: DHU‐CBA3; 3: DHU‐CBA2; 4: DHU‐CBA3 (+); 5: DHU‐CBA2 (+); “(+)” represents laser irradiation): A) Photographs of the tumors and B) tumor volume, at the end of the observation period. Experimental data in (B) were presented as mean ± SD. Statistical significance was calculated via one‐way ANOVA with Tukey's test. (n = 3–5 individual animals per group, * p < 0.05, ** p < 0.01, *** p < 0.001). C) Paralysis rate monitoring. Statistical significance was calculated via a log‐rank test for comparison. (n = 5 individual animals per group, * p < 0.05, ** p < 0.01, *** p < 0.001). D) 3D and planar view reconstruction images of spines showing the osteolytic vertebral plate (white arrow) and anterior centrum (red arrow) at the end of the observation period. (E) Bone mineral density (BMD) of lumbar three. Experimental data were presented as mean ± SD. Statistical significance was calculated via one‐way ANOVA with Tukey's test. (n = 3–5 individual animals per group, * p < 0.05, ** p < 0.01, *** p < 0.001). (F) TUNEL staining, (G) CD8+ T cells staining, and (H) IFN‐γ secretion. Experimental data in (H) were presented as mean ± SD. Statistical significance was calculated via one‐way ANOVA with Tukey's test. (n = 3 individual animals per group, * p < 0.05, ** p < 0.01, *** p < 0.001).
