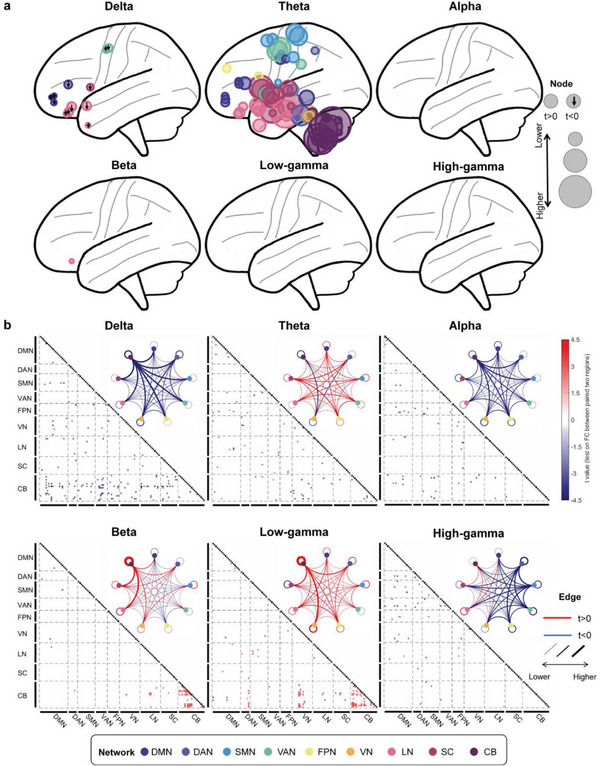
Figure 2.

The discrepancy oscillatory activity pattern between PKD and HC on the eye‐close paradigm. a) Visualization of oscillatory activity difference (PKD vs HC) patterns on the brain. The node size at each significant region (corrected p‐value <0.05 after FDR correction) represents its absolute t‐value, the larger the size, the more significant it becomes. A downward arrow on the node indicates that the oscillatory activity of PKD is significantly lower than HC (t‐value <0), and the node without an arrow indicates that PKD is significantly higher than HC (t‐value > 0). b) Functional connectivity difference between PKD and HC. Squares in the triangular matrix are functional connectivity (FC) of paired brain regions, and only significant FCs are drawn (p < 0.05 after FDR correction). The black squares indicate that the diagonal elements in the FC matrices are non‐meaningful for our analysis. We averaged the t‐values for each network and displayed them with a circular plot. The circle color represents different networks; the lines between or within the circle are the averaged t‐value. The blue line indicates that the t‐value is >0, while the red line indicates that the t‐value is ˂0, and the thicker the line, the greater the absolute value of t. We divided the brain regions into nine groups according to their functional network membership. DMN: default mode network; DAN: Dorsal attention network; SMN: somatomotor network; VAN: ventral attention network; FPN: frontoparietal network; VN: visual network; LN: limbic network; SC: subcortical regions; CB: cerebellum.
