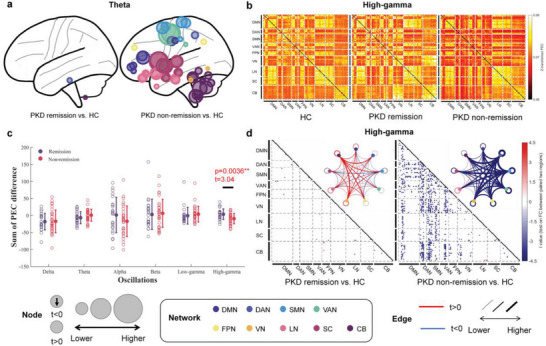
Figure 3.

The discrepancy oscillatory activity pattern of remission and non‐remission PKD patients on the eye‐close paradigm. a) Regions with significantly increased theta activity between remission or non‐remission PKD patients and HCs. b) Mean high‐gamma oscillation FC matrices of all HCs, remission, and non‐remission PKD patients. c) The sum of PEC differences between remission or non‐remission PKD patients and HCs. The non‐remission PKD patients were significantly higher than the remission PKD patients at the PEC on high‐gamma oscillation. d) High‐gamma oscillation FC difference between remission or non‐remission PKD patients with HC. The black squares in (d) indicate that the diagonal elements in the FC matrices are non‐meaningful for our analysis.
